Project management these days? It’s a wild ride. Shifting deadlines, overlapping tasks, scattered teams, and clients who want everything today—it’s a lot. Plans slip, handoffs get messy, and next thing you know, your timeline’s a guessing game.
This is where things turn around when you use a Gantt chart for project management.
It’s not just a neat little timeline—the Gantt chart becomes your north star. You can lay out the whole roadmap, show how every task connects, and instantly spot where one delay can domino into five others.
In this post, I’ll break down how to use Gantt charts without overcomplicating things:
- How Gantt charts work in real projects
- Where they help (and where they don’t)
- How to use them for effective project visualization
- How they fit into Agile and hybrid workflows
Let’s get into it.
What Is a Gantt Chart for Project Management?
At its core, a Gantt chart is a visual timeline that shows what needs to get done, when, and in what order. It maps out tasks as horizontal bars across a calendar so you can track progress, spot delays, and manage dependencies—all in one view.
Think of it as your project’s flight plan. Each task is a runway, and the chart shows which planes are landing when, which ones need to wait, and what happens if there’s a delay on the tarmac.
In project management, Gantt charts help turn scattered to-do lists into clear, connected workflows. They’re especially useful for long-term projects, complex timelines, and teams that need tight coordination.
Core Benefits of Using Gantt Charts
There’s a reason Gantt charts have stuck around while a dozen shiny new frameworks come and go; they work. When you’re running a real project with real people and real deadlines, you need more than a checklist. You need something that shows how it all connects.
Here’s where Gantt charts shine:
1. Dependency Management That Makes Sense: You can link tasks so one starts when the other ends—no mental gymnastics. If one deadline shifts, everything else adjusts with it.
2. Critical Path Clarity: You can spot the tasks that absolutely cannot slip. That’s your critical path—and Gantt charts make it painfully obvious when you’re on the edge.
3. Visual Timeline Tracking: Everyone sees the exact roadmap. Tasks, owners, deadlines—it’s all right there. No more digging through Slack threads or outdated documents.
4. Smarter Resource Planning: Overbooked devs? Idle teammates? Gantt views help you balance workloads before they become a problem.
5. Cross-Team Coordination: For multi-department projects, especially in hybrid or Agile setups, Gantt charts keep everyone aligned without forcing them into the same day-to-day process.
6. Accountability Without Micromanagement: You don’t have to hover. The chart does the job. When timelines and dependencies are laid out in the open, everyone sees the impact of a delay.
Bottom line: Gantt charts give you control, clarity, and a whole lot less chaos.
What Is a Gantt Chart Used for in Project Management?
Gantt charts are the closest thing to X-ray vision for your project. They don’t just tell you what needs to get done—they show you how it all fits together.
Here are a few examples of how a Gantt chart is used for project management in the real world:
- Mapping dependencies: You can line up tasks so one starts only after another finishes. It’s like building a chain. Miss one link, and you see instantly what’s at risk.
- Laying out the full timeline: From kickoff to delivery, Gantt charts let you visualize the entire journey—no surprises, no guesswork—just a clean, scrollable roadmap.
- Spotting bottlenecks early: If a task’s going to cause trouble, you’ll see it. Gantt charts help you catch delays before they ripple across the project.
- Keeping everyone aligned: Whether it’s your dev team, a vendor, or a client who “just wants a quick update,” a Gantt chart shows them exactly where things stand.
- Planning resources: Who’s working on what, and when? Gantt charts help avoid double-booking or idle downtime by making workloads visible.
Long story short, if your project has multiple moving parts, deadlines that actually matter, and people who need clarity, Gantt charts are your friend.
How to Use a Gantt Chart for Project Management
I’ve tried my fair share of Gantt chart software that claim to do Gantt charts well—but most either overcomplicate the basics or feel like an afterthought.
ProProfs Project was a rare exception. It gave me exactly what I needed: a clean, no-fuss Gantt view that actually helped manage timelines, dependencies, and team workloads without the usual setup pain.
Here’s a quick look at how I’ve used it, and how you can use Gantt chart for project management:
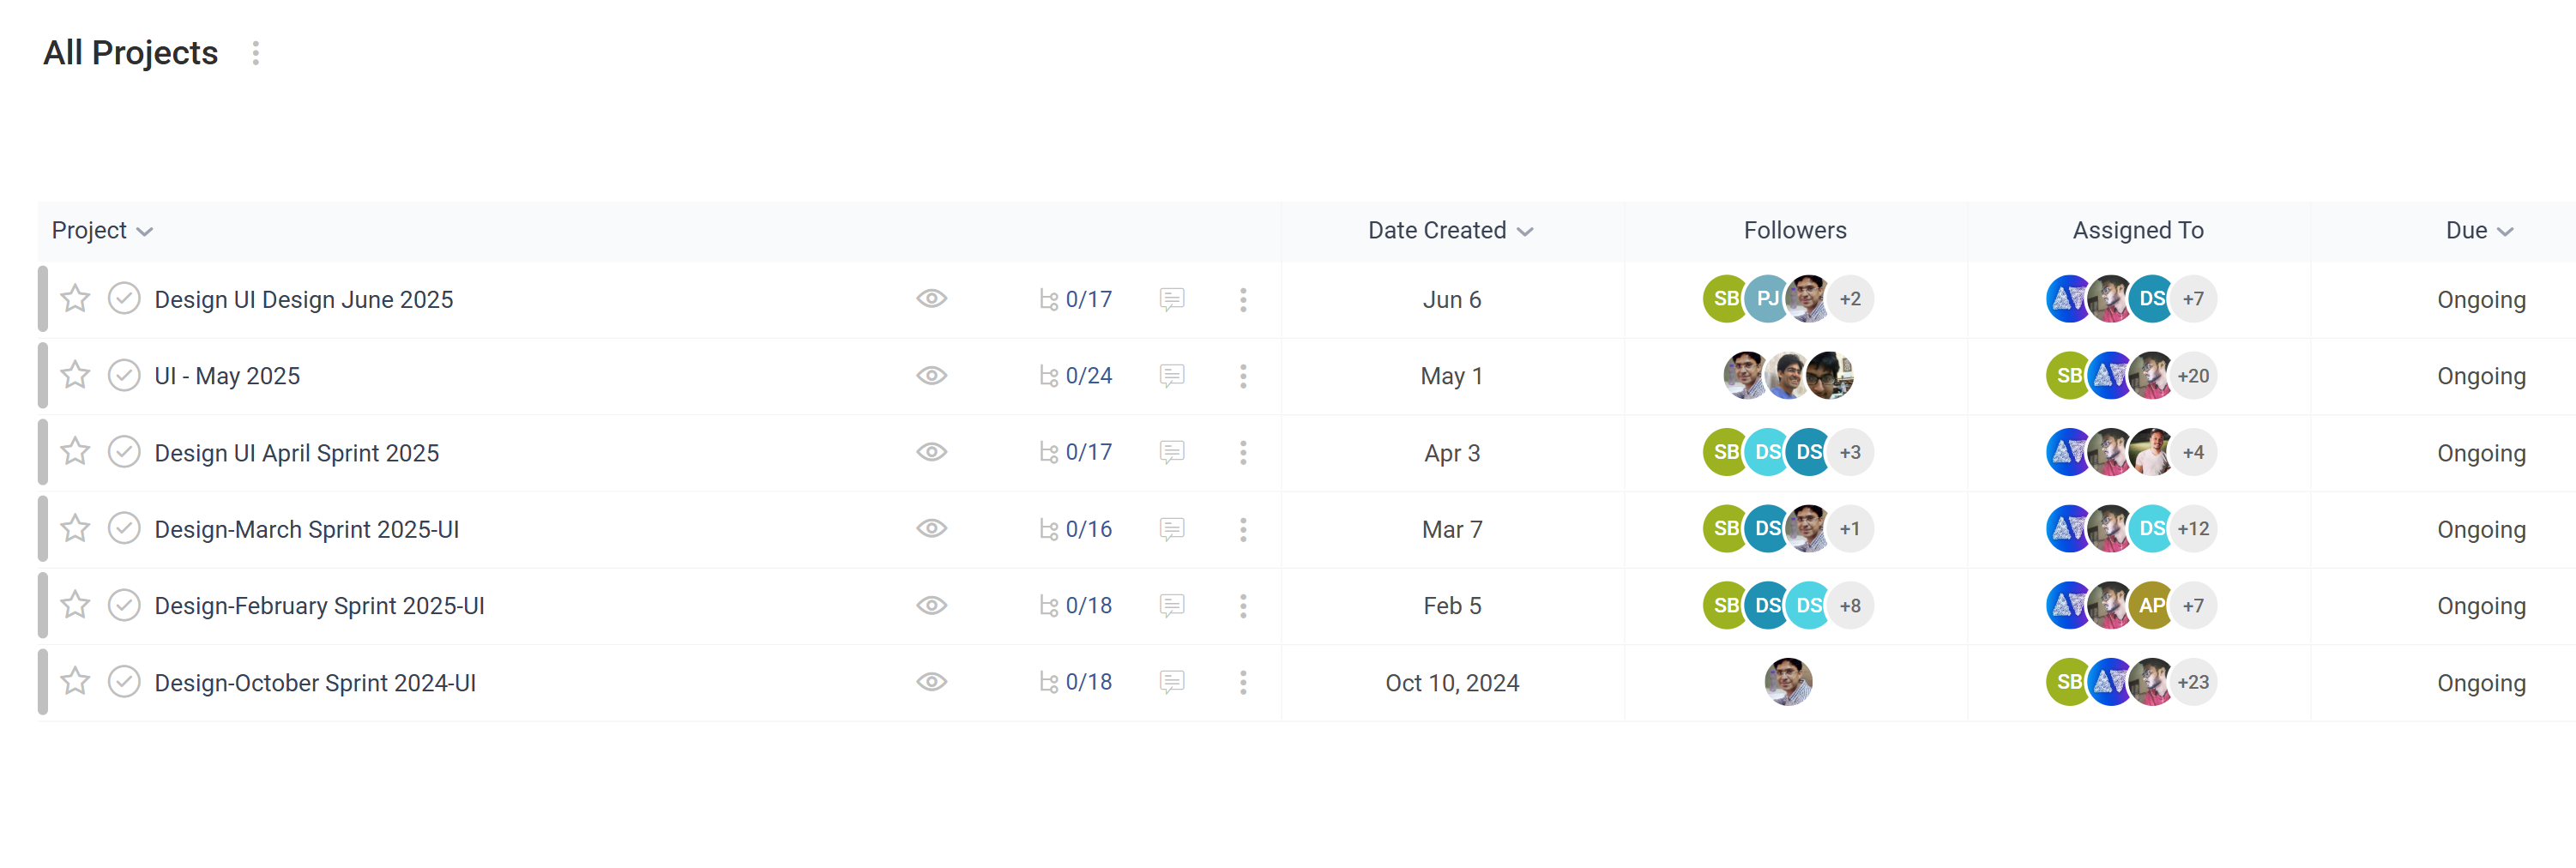
Step 1: Access Your Project
From your dashboard, just click on the project you want to manage.
Step 2: Switch to Gantt View
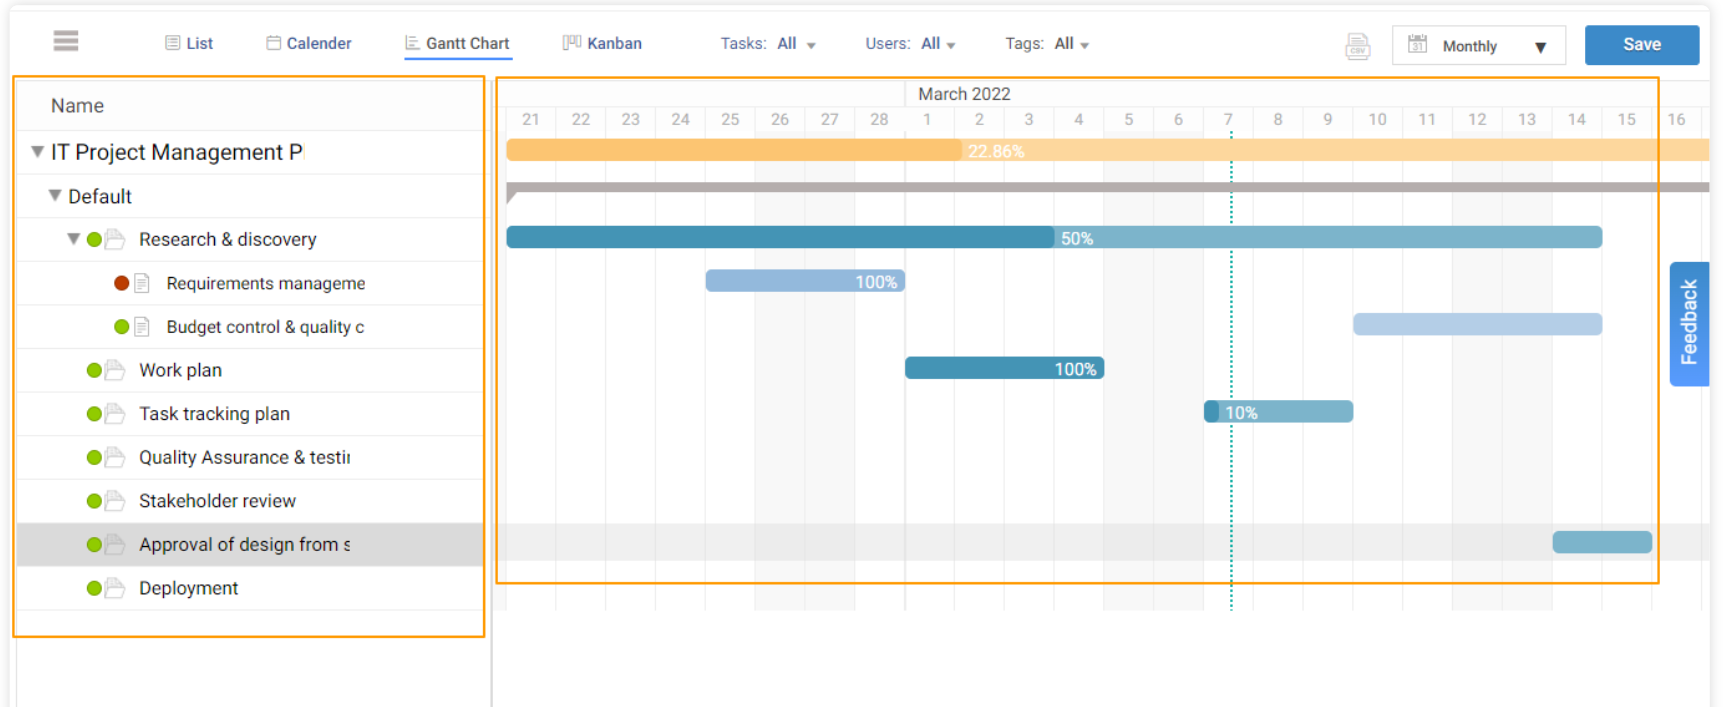
Click the “Gantt Chart” icon at the top right, and you’ll get a full timeline view of the project.
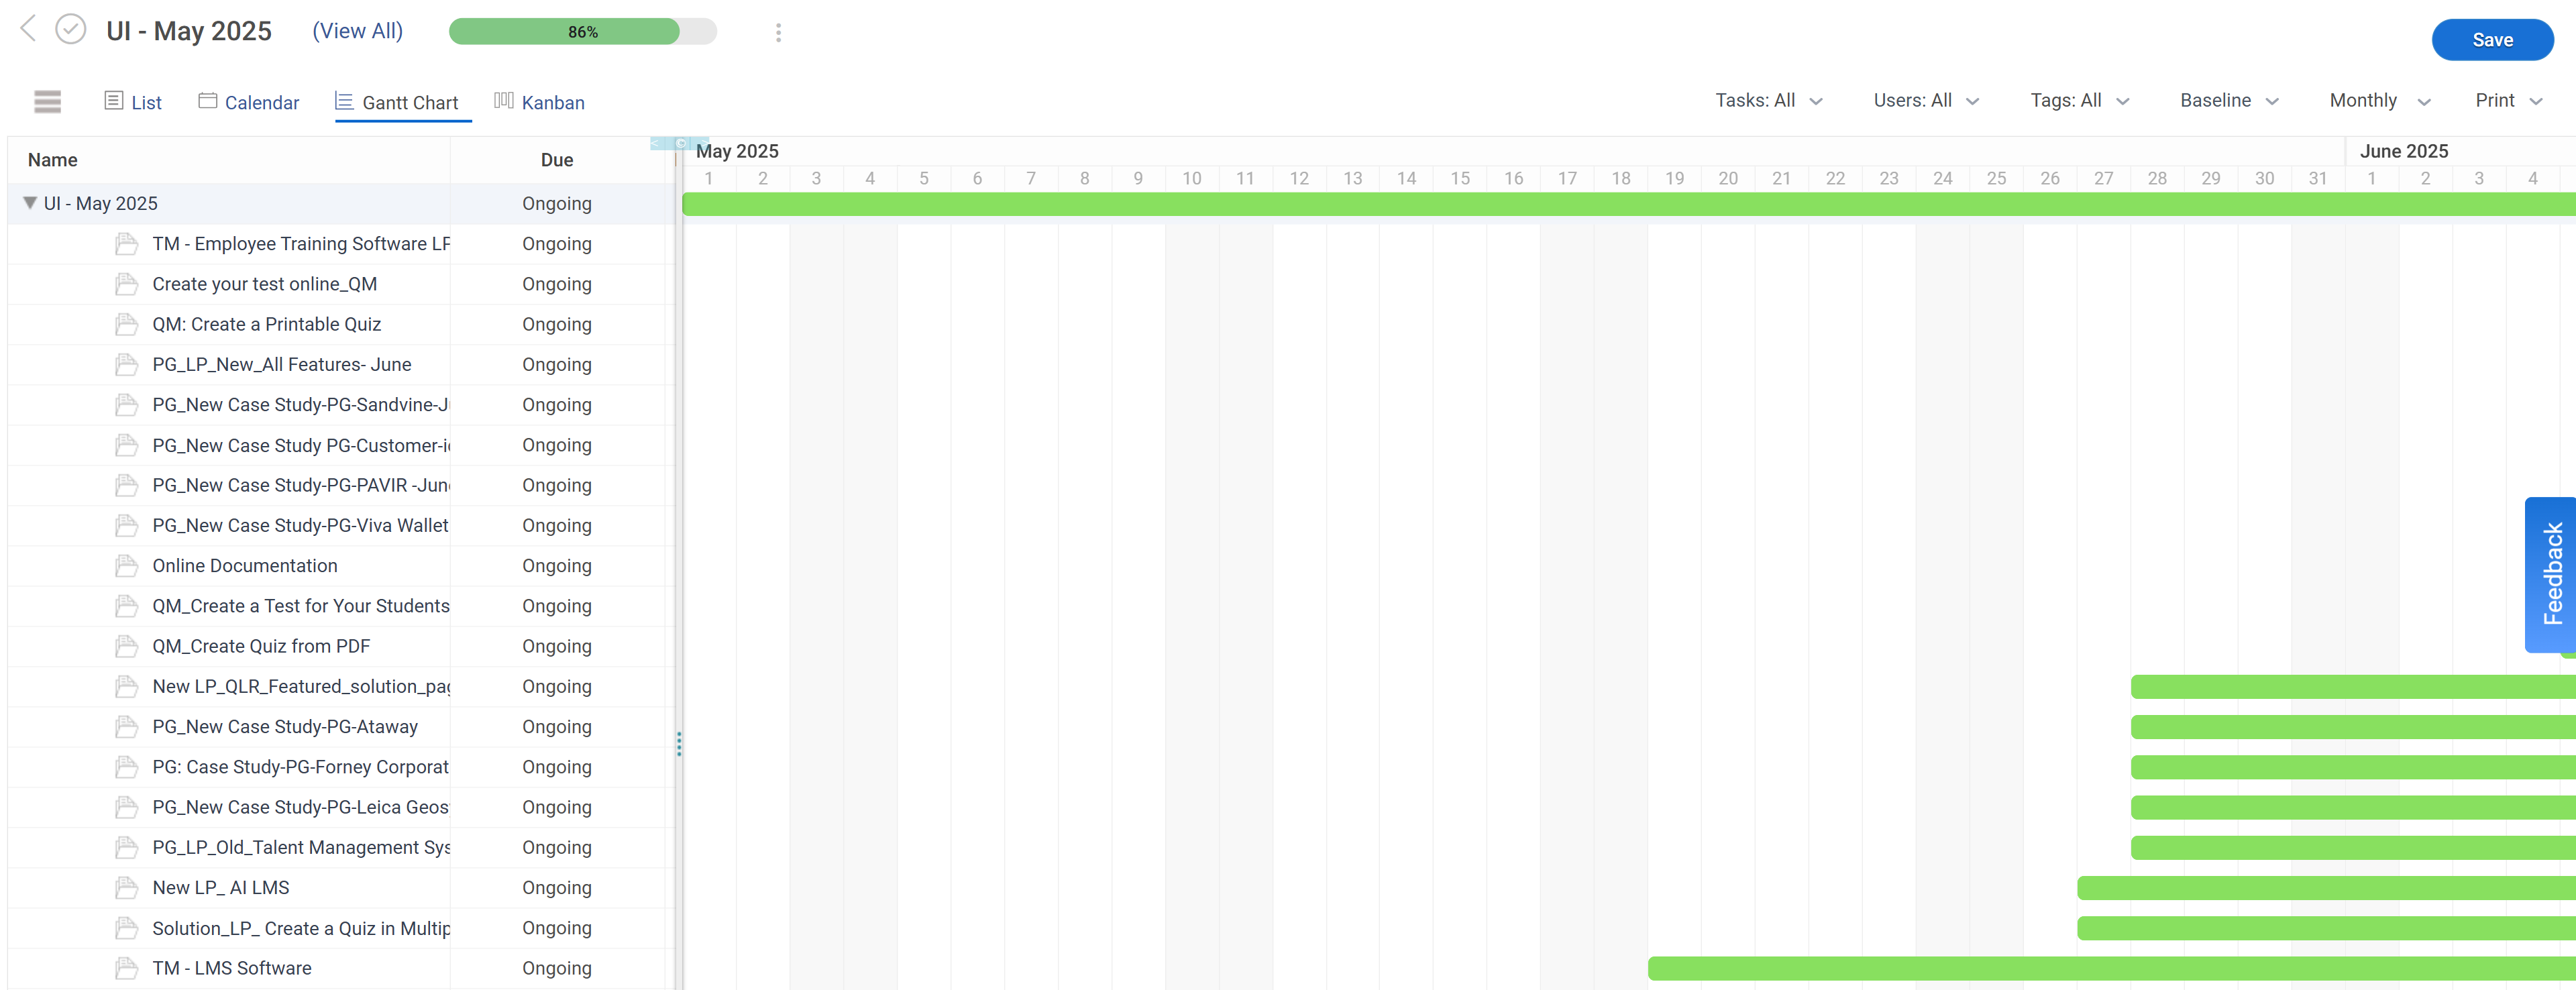
Step 3: Understand the Layout
- On the left: every task and subtask
- On the right: timeline bars that show duration, progress, and dependencies
- Orange = full project
- Blue = individual tasks and subtasks
What You Can Actually Do With It
1. View or Edit the Full Project: Click the project name (or its orange bar) to open the detail view. From there, you can:
- Rename the project
- Update deadlines
- Add/remove team members
- Set reminders, update progress, attach files—you name it
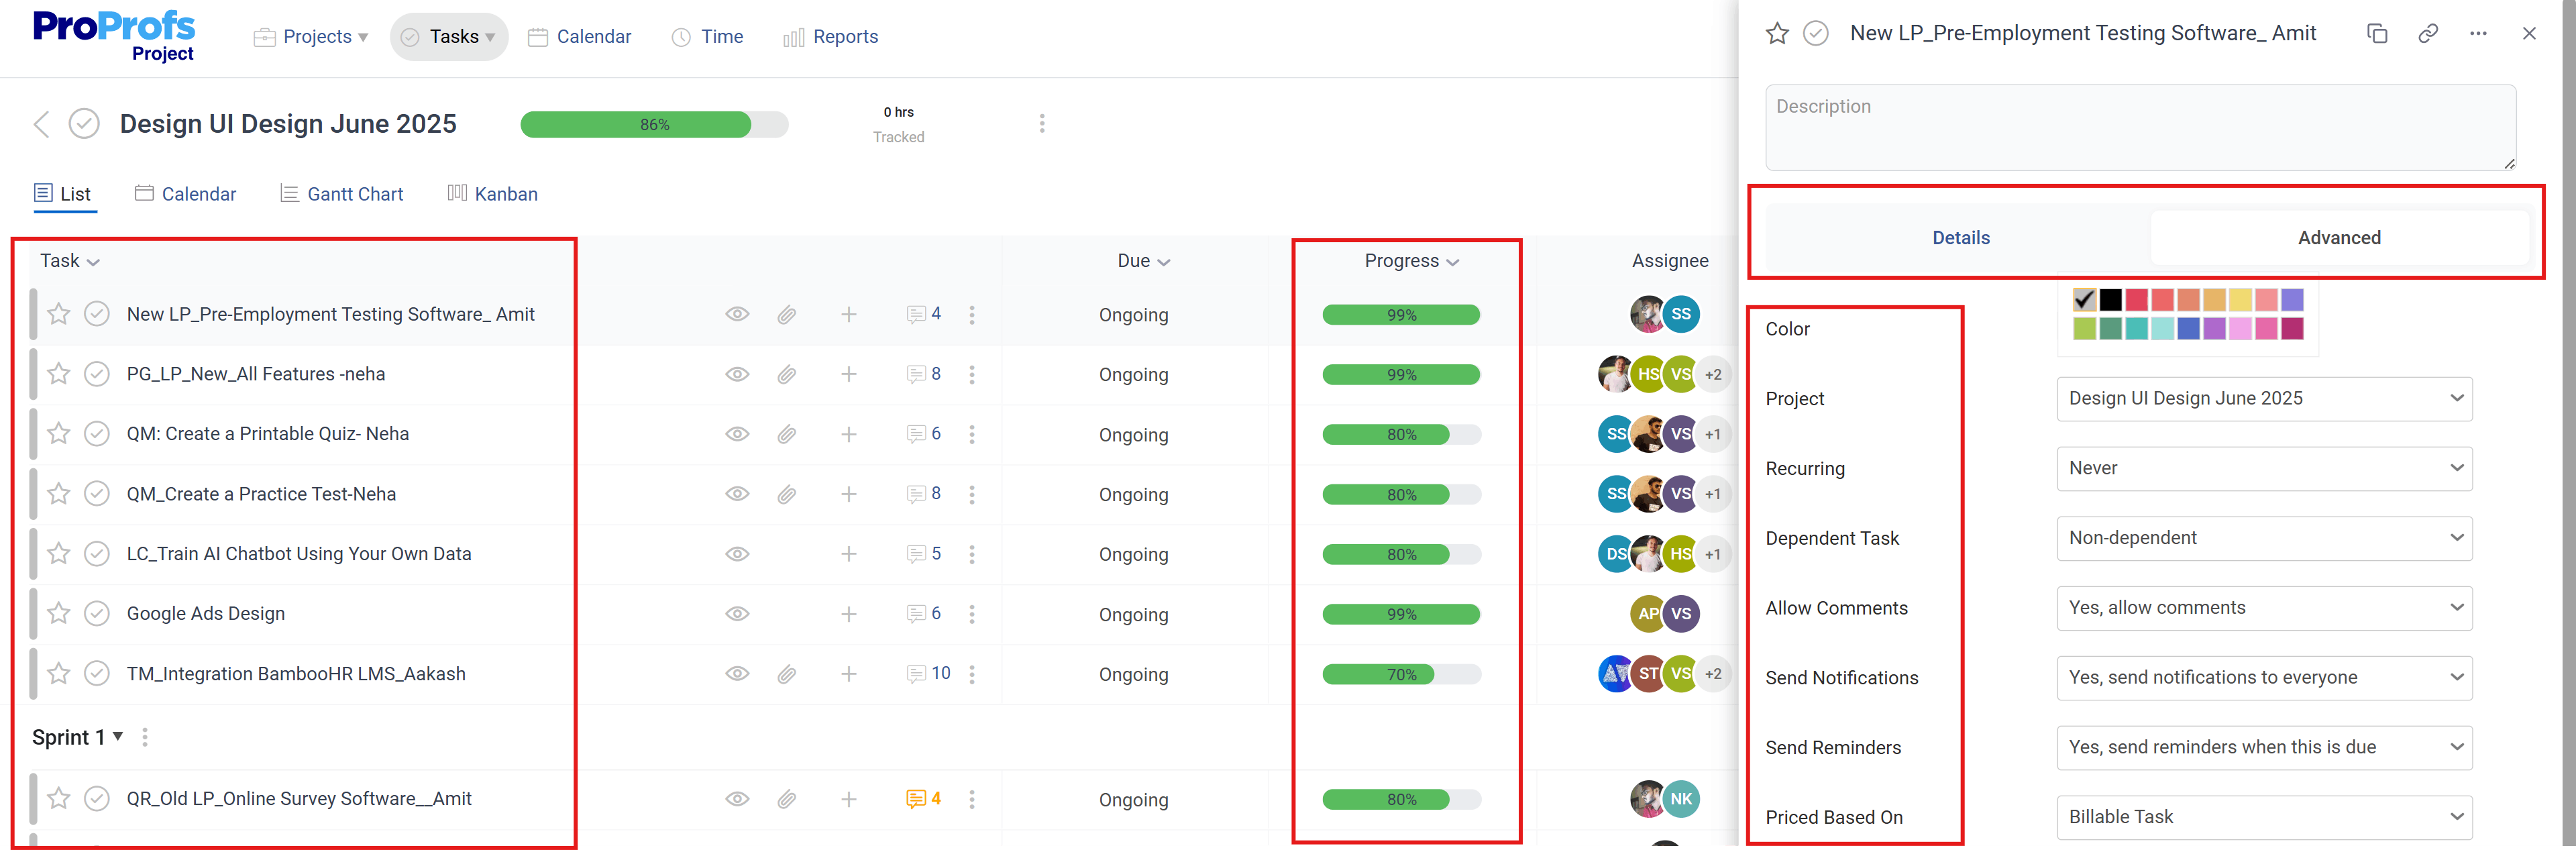
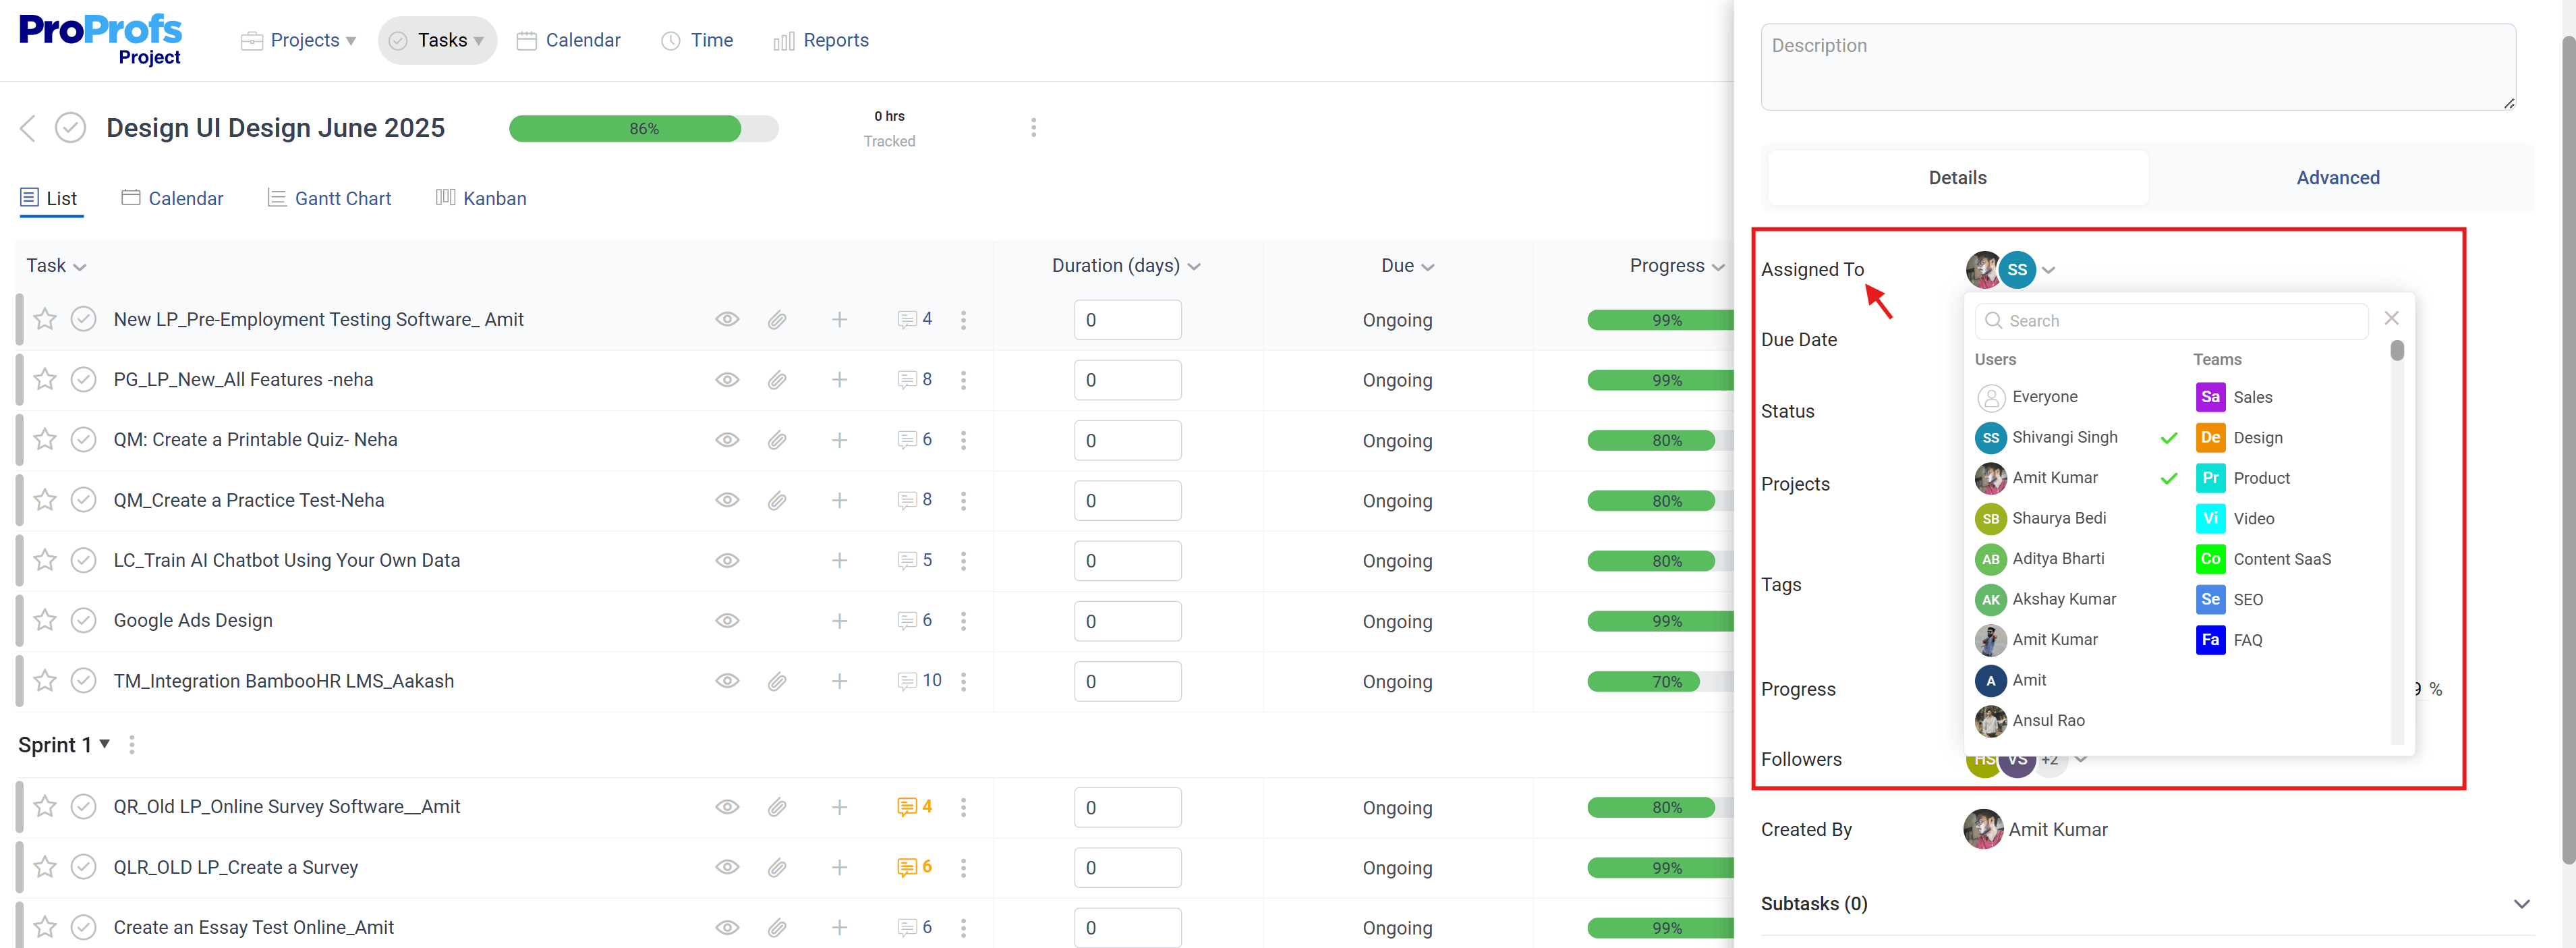
2. Edit Any Task: Same deal—click a task name or bar to adjust its timeline, update progress, or assign teammates.
3. Update Task Statuses: Click the status dot next to any task to mark it Active, On-Hold, or Inactive. No digging through settings.
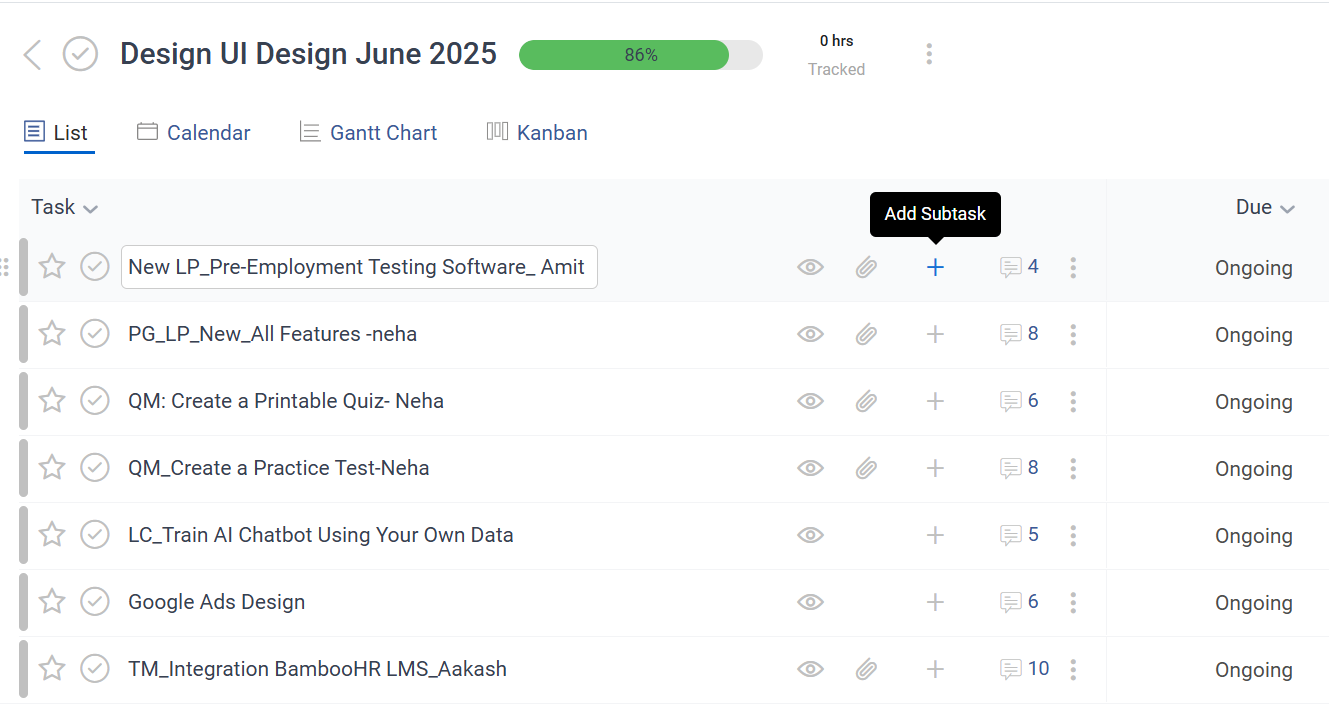
4. Add or Remove Tasks/Subtasks: Click the + button to add new items, or the X icon (on hover) to delete.
5. Collapse or Expand Sections: Use the arrow toggle to zoom in or out of task groups—it’s great for cutting noise when you’re managing bigger projects.
6. Reorder Tasks: Drag and drop tasks up or down to reprioritize on the fly.
7. Adjust Timelines Directly: Stretch or move any task bar to shift timelines without breaking the rest of the plan. Dependencies and durations update automatically.
Still having doubts? No worries! Here’s a quick guide to help you use Gantt charts for project management.
Here’s a real-life example of how Xtencil uses ProProfs Project to visualize their projects using Gantt Charts and Kanban Boards.
Best Practices to Make Gantt Charts Work for You
A Gantt chart isn’t just about managing tasks—it’s about keeping things under control. But here’s the deal: if you treat it like a pretty graphic and never touch it again, it’ll fall apart. Fast.
So let’s get practical. Here’s exactly how to make your Gantt chart work—from day one to done.
| Best Practice | What to Do (Step-by-Step) | Why It Matters |
|---|---|---|
| 1. Start with milestones, not everything | - Add only major milestones (e.g. “Launch MVP”, “Client Review”) first - Break each into 3–5 essential tasks only |
Prevents clutter and keeps your chart easy to follow |
| 2. Use dependencies, not manual dates | - Link tasks using “start-after” logic (drag a connector between tasks) - Only use dates where absolutely necessary |
Timelines auto-adjust when delays happen—no manual rework |
| 3. Assign owners to every task | - Click each task bar and assign a team member right away - Add 1-sentence descriptions with clear deliverables |
Builds instant accountability and eliminates “who owns this?” confusion |
| 4. Update weekly during check-ins | - Review Gantt chart every Monday or Friday - Shift timelines, update progress bars, mark tasks complete |
Keeps the chart real-time and avoids last-minute surprises |
| 5. Plan in Gantt, execute elsewhere | - Map out project flow in Gantt view - Use Kanban/List views for daily work - Toggle views as needed (ProProfs Project supports this natively) |
Gantt is for alignment—your team works best in task-level tools |
| 6. Clean it up monthly | - Archive completed tasks - Collapse old sections - Remove irrelevant or outdated tasks |
Keeps your chart useful and prevents it from becoming a visual mess |
Here’s a quick video for you to learn how to handle project management effectively:
Are Gantt Charts Agile-Compatible? Yes—Here’s How
A lot of people think Gantt charts don’t belong in Agile. Too rigid, too top-down, too slow.
But here’s the reality: most teams today aren’t running pure Agile. You’ve got deadlines, handoffs, launches, and other moving parts that don’t always fit neatly into a sprint board.
That’s where Gantt charts help. They give you a bird’s-eye view of what’s coming, how work connects across teams, and where things might fall through the cracks.
You just have to use them the right way.
How to Make Gantt Charts Work Without Breaking Agile
1. Focus on Big Pieces, Not Tiny Tasks
Do this: Use your Gantt chart to show big blocks of work—like releases, epics, or key deadlines. Don’t try to cram in every single task from your backlog.
Example: Add “Marketing launch,” “Frontend sprint,” or “Beta release” to your Gantt. Keep the daily stuff in your Kanban or task board.
2. Connect Teams With Dependencies
Do this: Draw lines between tasks that rely on each other—so if one slips, the others shift too. This is perfect for when multiple teams need to stay in sync.
Example: If Dev needs to finish before QA starts, link those tasks. Everyone sees what’s dependent and what’s on track.
3. Match It to Your Sprint Rhythm
Do this: Use your sprint cycles to shape your Gantt. For example, map out two-week chunks and update the chart when a sprint ends or a deadline moves.
Why it helps: You stay aligned without making the team change how they work.
4. Show It to Stakeholders, not the Team
Do this: Keep the Gantt chart clean and high-level. Use it to show execs, clients, or other teams what’s coming and when. Don’t clutter it with user stories or daily tasks.
Why it helps: Everyone gets visibility without dragging your team into another tool.
5. Let Your Team Work How They Work
Do this: Use the Gantt chart for planning and updates, but let your team live in whatever view they prefer: Kanban, List, or Calendar. There is no need to force it on everyone.
Why it helps: You get structure without slowing anyone down.
Don’t Just Use Gantt Charts—Make Them Count
A Gantt chart isn’t a legacy tool. It’s a clarity tool when you use it with purpose.
Just don’t treat it like a checklist replacement or try to force it into every part of your workflow. Let your team execute however they work best and use the Gantt chart to see the bigger picture.
That’s precisely what I found with ProProfs Project. You don’t have to fight the tool or teach your team a new system. The Gantt view works out of the box, gives visibility, and lets the rest of the team keep working in whatever view they prefer. You can sign up for free if you’re just starting out.
In the end, it’s not about the chart. It’s about making better decisions, earlier—and that’s what a good Gantt setup gives you.
Frequently Asked Questions

Are Gantt charts useful in Agile project management?
Yes, when used the right way. Agile teams often use Gantt charts to map out epics, release timelines, or dependencies between squads. It’s not about managing daily standups with a Gantt—it’s about getting a clear view of the broader plan without derailing Agile workflows.
How do Gantt charts help manage task dependencies?
Gantt charts let you connect tasks visually—so if Task B depends on Task A finishing first, that relationship is mapped out. When one deadline shifts, the rest update automatically. This keeps your entire timeline honest and prevents last-minute surprises.
What are the downsides of using Gantt charts?
They can be time-consuming to set up, especially for fast-moving or small projects. If you overfill them with too much detail, they get messy. And in pure Agile setups, they can feel too rigid—unless you use them purely for planning and alignment, not day-to-day execution.
Can Gantt charts show real-time project progress?
Absolutely—if your tool supports it. In ProProfs Project, for example, progress bars update as tasks are marked complete, and you can quickly see what’s on track, what’s slipping, and where dependencies might cause a delay. No manual reporting needed.
FREE. All Features. FOREVER!
Try our Forever FREE account with all premium features!