Great projects don’t just come together. They need clarity, momentum, and a system that keeps everyone aligned.
When I was managing multiple client projects, I started with spreadsheets and emails. It seemed simple enough, but things quickly got messy. I missed deadlines with overdue tasks piled up, and keeping everyone on the same page became a full-time job.
That’s when Gantt charts helped me manage everything in one place. They helped me see the full picture, track dependencies, and keep projects moving without all the follow-ups.
In this guide, I’ll share 15 top Gantt chart examples by industry, plus a simple step-by-step guide on creating your own in minutes.
Let’s dive in.
What Is a Gantt Chart?
“A Gantt chart is defined as a graphical representation of activity against time; it helps project professionals monitor progress.”
Usually, it’s a bar chart showing a project’s schedule. It displays the project’s tasks, milestones, and dependencies along a horizontal timeline.
Each task is represented by a horizontal bar that shows its start and end dates, duration, and completion percentage.
You can check this short video for a clearer idea of what it looks like and why you must use it for project management –
You can use different colors to show each task’s priority, status, or category. Wondering how to create one? You can do that using dedicated project management software like ProProfs Project.
15 Best Gantt Chart Examples
Project managers today consider Gantt charts more powerful than just a real-time progress tracker.
I gathered input from HR heads, team leads, and project managers to create a list of the 15 best examples of Gantt charts.
Check them out below.
1. Project Management
Project management is the most common application of Gantt charts.
It is an excellent way to break down the work into manageable subtasks, assign responsibilities, and track progress, especially when there are many tasks and dependencies.
For example, in industries like engineering or tax services, teams often manage complex, deadline-driven deliverables across departments.
A Gantt chart helps project leads assign work clearly, track dependencies, and avoid bottlenecks, especially when multiple approvals, resource handoffs, or client check-ins are involved.
In the image below, the timeline depicts the primary and crucial project information:
- The project’s name
- Start and end date of the project
- Tasks/subtasks and their duration
- Task dependency
- Workload.
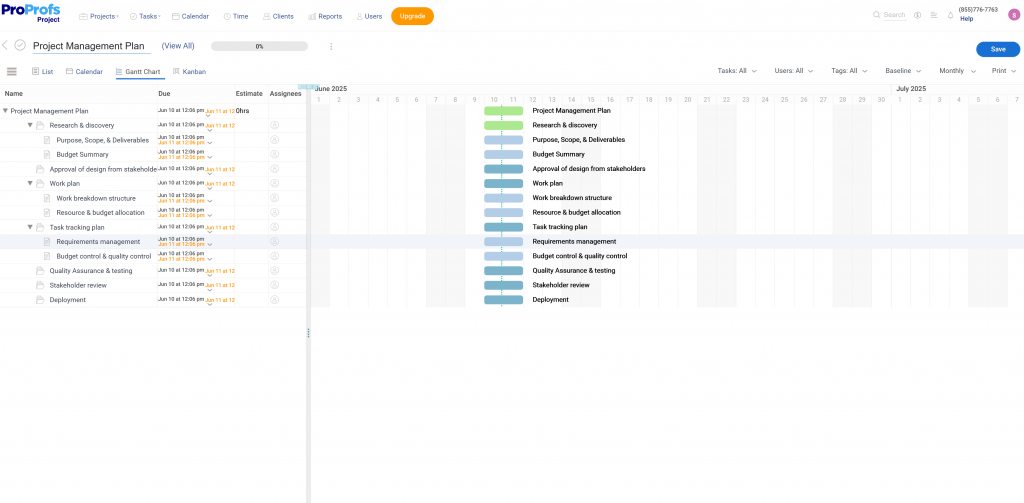
The timeline view visually represents the project, making planning and allocating resources easier. The dependencies and milestones help you identify critical path tasks and potential bottlenecks and adjust your schedule accordingly.
If you’re looking to get started, this Gantt chart example for a project proposal can make this process even easier to visualize and implement.
Use Cases by Industry
- Construction & Engineering: Plan and track building phases, subcontractor timelines, inspections, and regulatory milestones.
- Software Development & IT: Manage product development sprints, QA testing, release schedules, and feature rollouts.
- Marketing & Advertising: Coordinate campaign tasks—creative production, media buying, launch timelines, and reporting.
- Event Planning: Organize logistics, vendor coordination, promotional timelines, and day-of-event execution.
- Manufacturing & Supply Chain: Schedule production cycles, material procurement, inventory management, and shipment deadlines.
2. Human Resource
As a human resource (HR) professional, you understand how there are so many things on your plate, like –
- Assessing current staff requirements
- Employee onboarding
- Recruitment process
- Employee offboarding
- Payroll management
- Managing/updating company policies
- Maintaining employees’ records
- Taking care of employee training and development
This example of a Gantt chart template for HR can track candidate interviews, onboarding, training, and more.
It can provide an overview of the recruitment process, including the timelines for candidate sourcing, interviewing, and hiring.
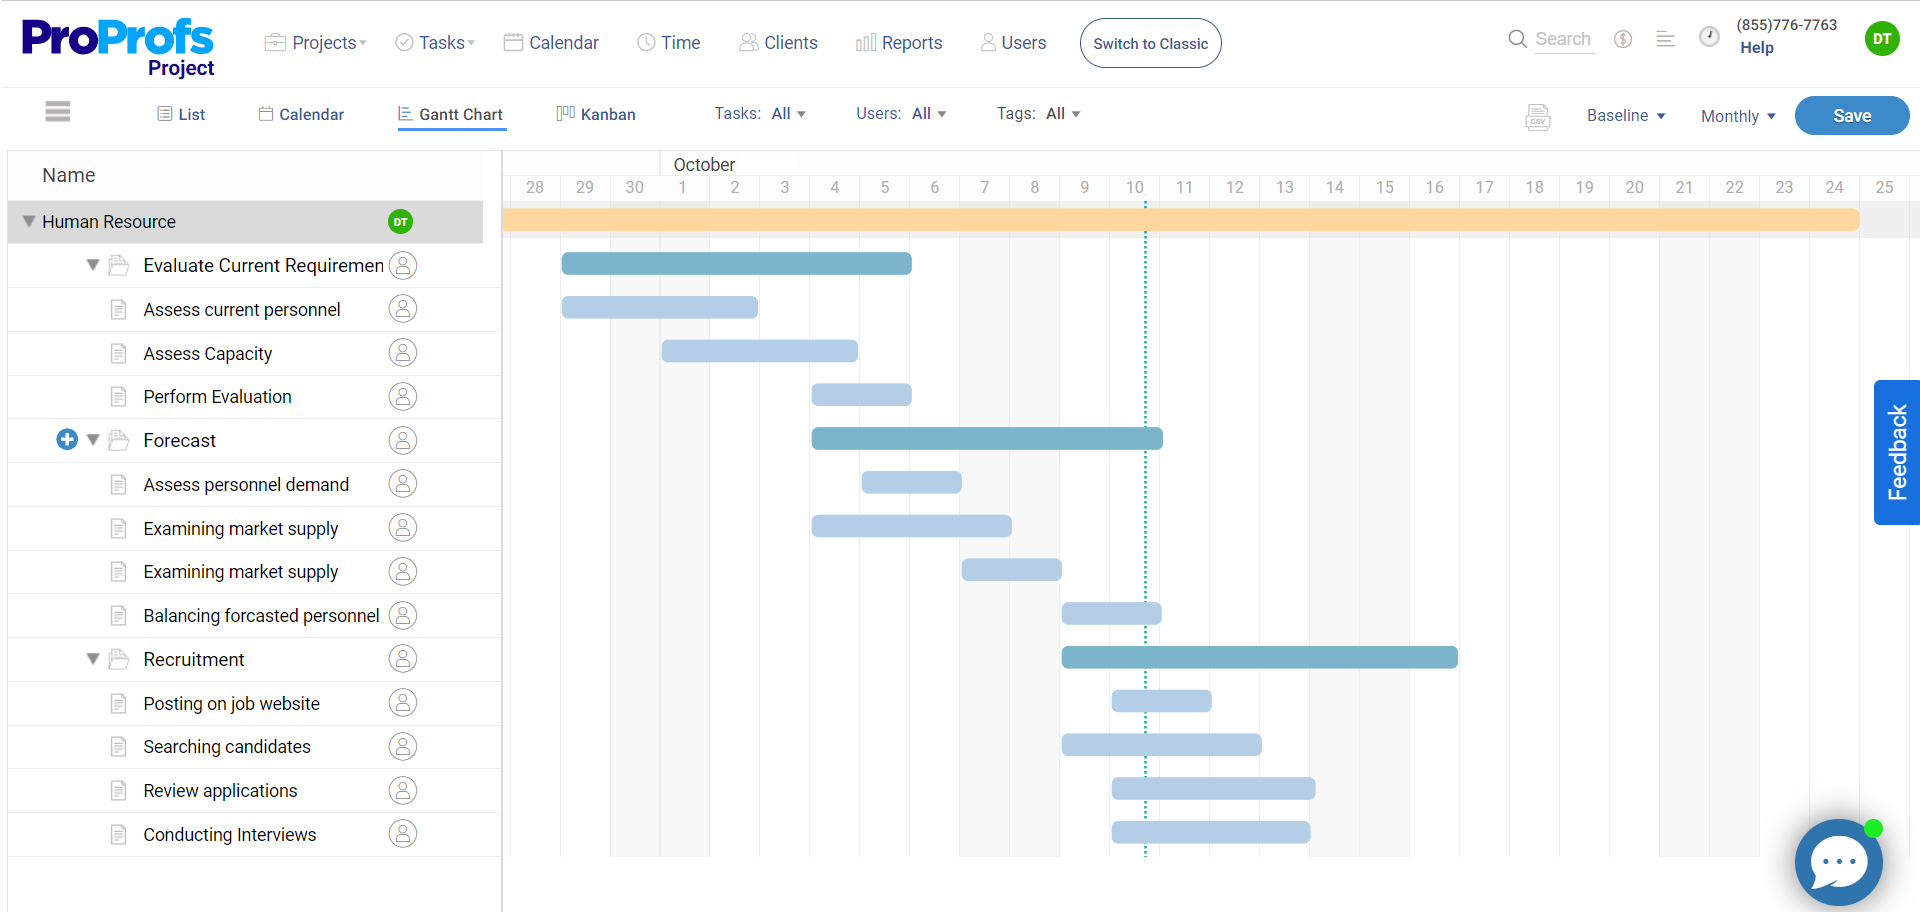
For instance, a Gantt chart can display the sequential steps in the hiring process, from posting job ads to conducting interviews and making offers, even managing remote candidates
Use Cases by Industry
- Corporate Enterprises: Manage high-volume hiring, onboarding timelines, cross-department training schedules, and compliance checklists.
- IT & Software Development: Coordinate fast-paced tech recruitment, remote onboarding plans, and technical training programs.
- Healthcare & Hospitals: Plan staff hiring, credential verification, medical onboarding, and regulatory training schedules.
- Educational Institutions: Schedule academic staff recruitment, faculty onboarding, semester prep, and teacher development programs.
- Retail & Hospitality: Organize seasonal hiring, new staff onboarding, shift planning, and customer service training across locations.
3. Business Plan
Creating a business plan involves numerous moving parts, from market research to financial forecasting.
A Gantt chart can break down the monumental task of launching a business into manageable pieces.
It could outline the journey from conceptualization, securing funding, product development, and market entry, helping you track progress against milestones and adjust plans as the business environment changes.
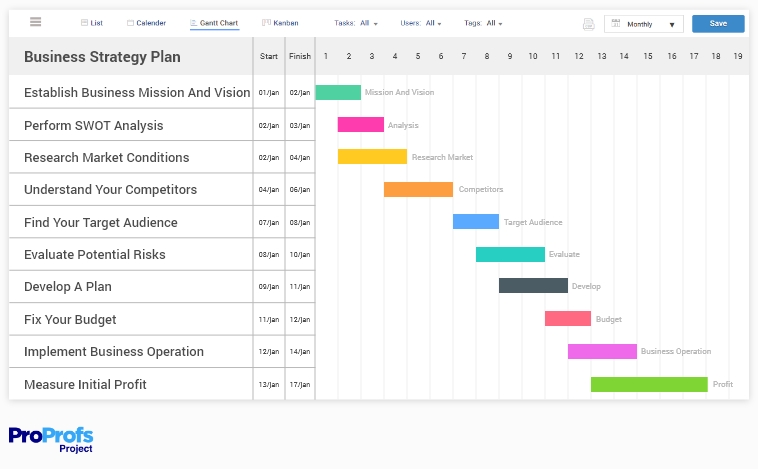
For instance, in the Gantt Chart below, you can see that before researching the market and competitors, you need to define the business vision and perform a SWOT analysis.
Use Cases by Industry
- Startups & Entrepreneurship: Structure the business launch process, from ideation and funding to MVP development and go-to-market strategies.
- Financial Services: Plan new service rollouts, conduct risk assessments, build investment models, and schedule regulatory submissions.
Retail & E-commerce: Organize product sourcing, platform development, marketing plans, and launch timelines for new stores or collections. - Healthcare & Wellness: Coordinate service development, facility setup, licensing, and phased rollouts for clinics or health products.
- Education & EdTech: Outline curriculum development, platform creation, partnership building, and student acquisition strategies.
4. Sales Process
Working as a sales representative involves various challenges – cold calling, contacting potential customers, making follow-up calls, delivering sales presentations, sending emails, and conducting video conferences. It’s a demanding job.
Losing track of any of these can derail the entire team. But luckily, with Gantt charts, that won’t happen.
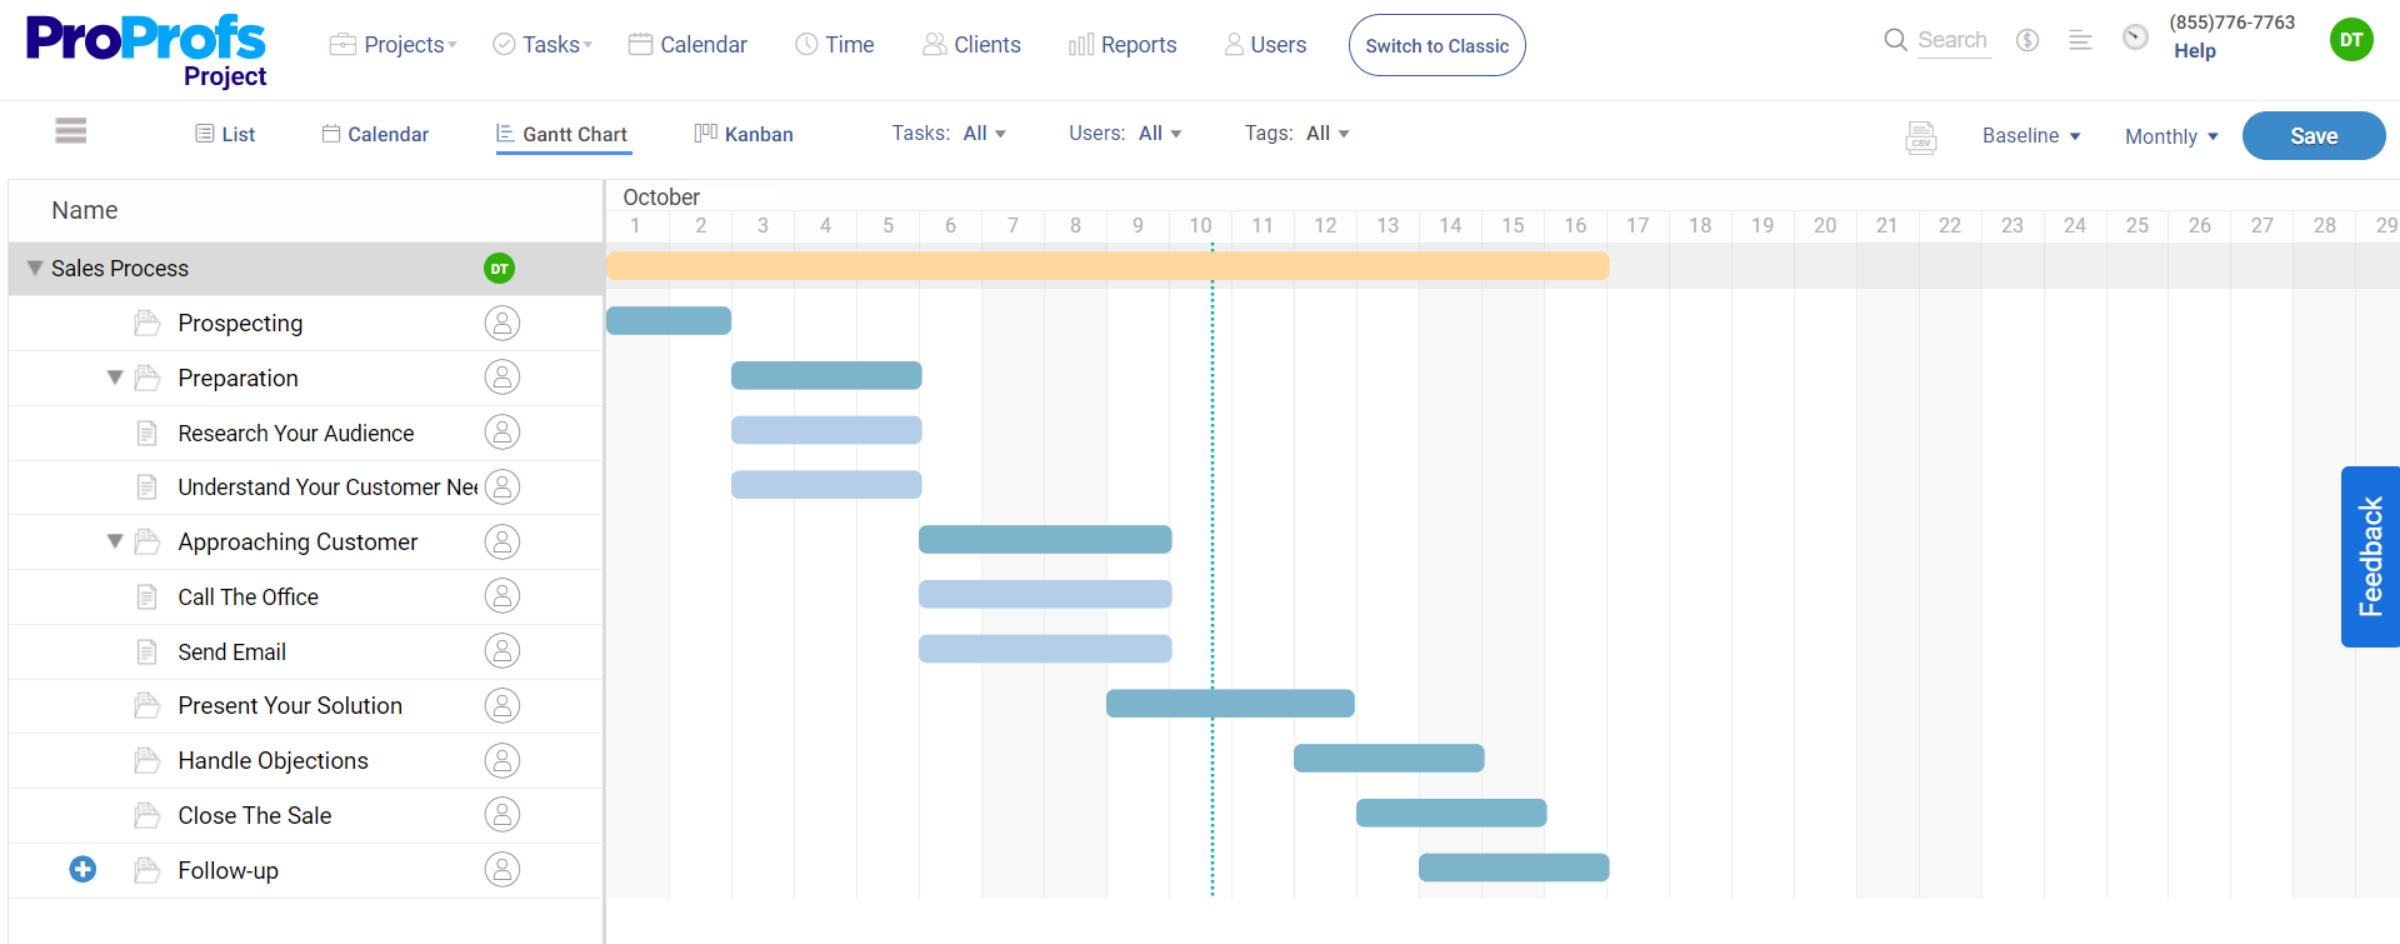
Sales teams can use Gantt charts to map out the sales cycle for key accounts, from initial contact through negotiation, closing, and post-sale follow-up.
Monitoring lead conversion rates, sales targets, and other critical KPIs helps identify potential bottlenecks, adjust resources, and optimize the sales funnel.
Use Cases by Industry
- B2B Technology & SaaS: Track the sales funnel for enterprise clients, from lead generation to demos, negotiations, and onboarding.
- Real Estate: Manage property listings, client outreach, showings, negotiations, and closing timelines for each deal.
- Pharmaceutical & Medical Devices: Coordinate long sales cycles involving stakeholder meetings, regulatory discussions, and procurement approvals.
- Automotive Sales: Monitor dealer outreach, inventory sales targets, test drives, financing negotiations, and customer follow-ups.
- Financial Services & Insurance: Organize lead engagement, policy presentations, client meetings, underwriting steps, and policy closures.
5. Marketing
In marketing, Gantt charts can be invaluable for planning campaigns across different channels.
It can help you coordinate the launch of a new advertising campaign, ensuring that creative development, media buying, and campaign analysis are completed in a timely and synchronized manner.
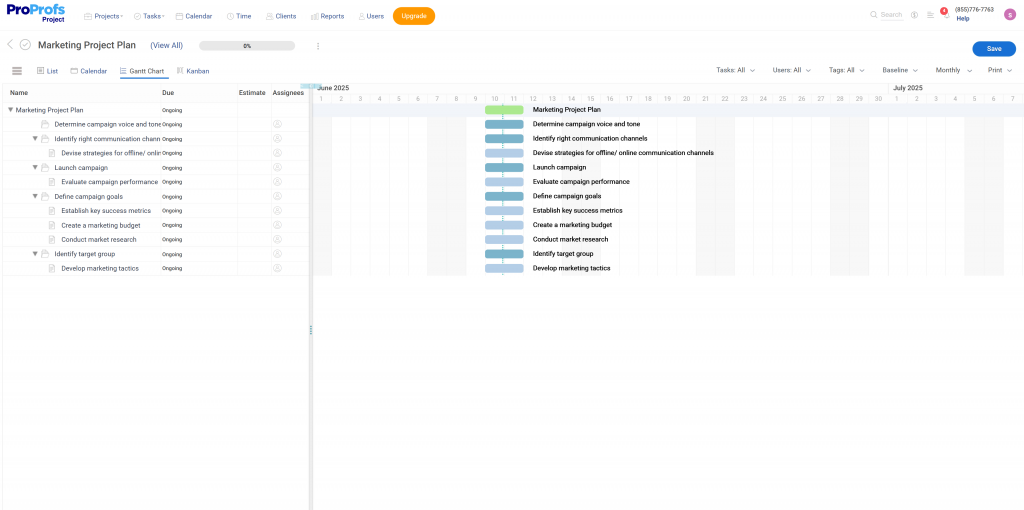
Gantt charts also visualize the overlap between tasks such as content creation, ad buying, and public relations efforts, ensuring that all campaign elements are coordinated and executed on time.
Use Cases by Industry
- E-commerce & Retail: Plan product launches, seasonal promotions, content creation, and cross-channel marketing campaigns.
- Entertainment & Media: Coordinate promotional schedules, content production, social media releases, and public relations efforts.
- Travel & Hospitality: Schedule destination marketing, seasonal offers, event promotions, and influencer collaborations.
- Education & EdTech: Manage student recruitment campaigns, course promotion, content calendars, and webinar schedules.
- Consumer Goods (FMCG): Align brand campaigns, packaging updates, digital ads, and in-store promotions across markets.
6. Product Management
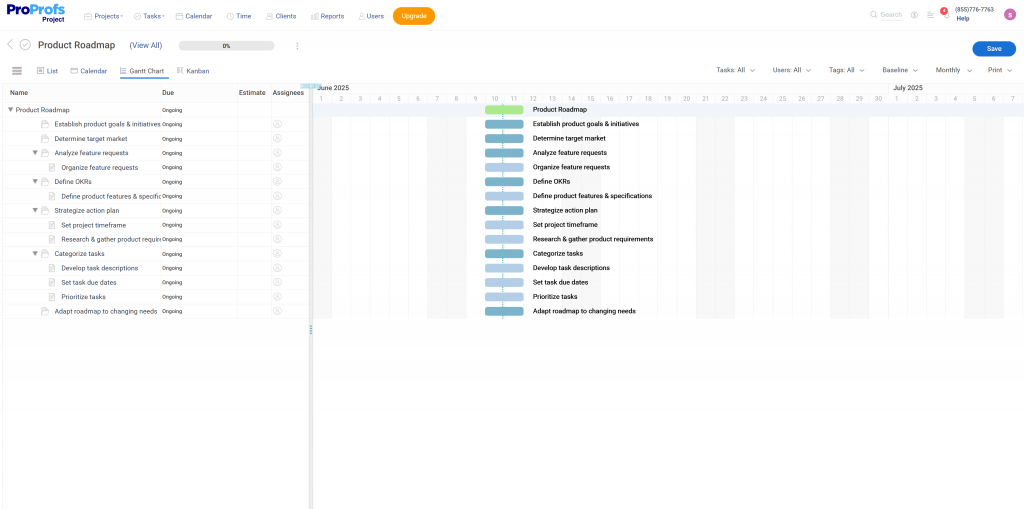
For product managers, Gantt charts provide a visual roadmap for product development, from ideation through design, testing, and launch.
It details phases such as market research, prototype development, user testing, and production. Such a visual overview of the product development lifecycle helps you efficiently allocate resources, set milestones, and track progress.
Use Cases by Industry
- Software & Technology: Plan feature roadmaps, manage sprint cycles, conduct user testing, and coordinate product launches.
- Consumer Electronics: Schedule R&D, hardware prototyping, compliance testing, and mass production timelines.
- Automotive Industry: Manage new model development, part sourcing, prototype testing, and production planning.
- Healthcare & Medical Devices: Coordinate clinical validation, regulatory approvals, design iterations, and product rollout.
- E-commerce Platforms: Oversee platform updates, UX redesigns, inventory system enhancements, and phased release strategies.
7. Media
Media and publishing projects, such as producing films, magazines, or digital content series, can be intricately planned with Gantt charts. These charts help schedule and track various stages of content creation, editing, and distribution, ensuring that deadlines are met and content is released as planned.
It’s particularly useful in managing cross-functional teams that include writers, designers, and marketers. It provides a common timeline that syncs everyone’s efforts toward the timely completion of media content.
Use Cases by Industry
- Film & Television Production: Schedule scriptwriting, casting, shooting, editing, and post-production to meet release timelines.
- Publishing & Print Media: Plan editorial calendars, article assignments, editing workflows, and print distribution cycles.
- Digital Content & Influencer Marketing: Manage video shoots, graphic design, approval processes, and multi-platform publishing.
- Advertising Agencies: Coordinate campaign storyboarding, asset creation, client approvals, and media placement deadlines.
- Gaming & Animation Studios: Track game or animation development stages, voiceovers, design iterations, and launch milestones.
8. Construction
Construction projects are complex, involving numerous subcontractors, regulatory approvals, and material deliveries.
With Gantt charts, you can break down the project into phases such as design, permitting, construction, and inspection, offering a clear timeline for each.
You can also highlight dependencies, such as completing the foundation before framing begins.
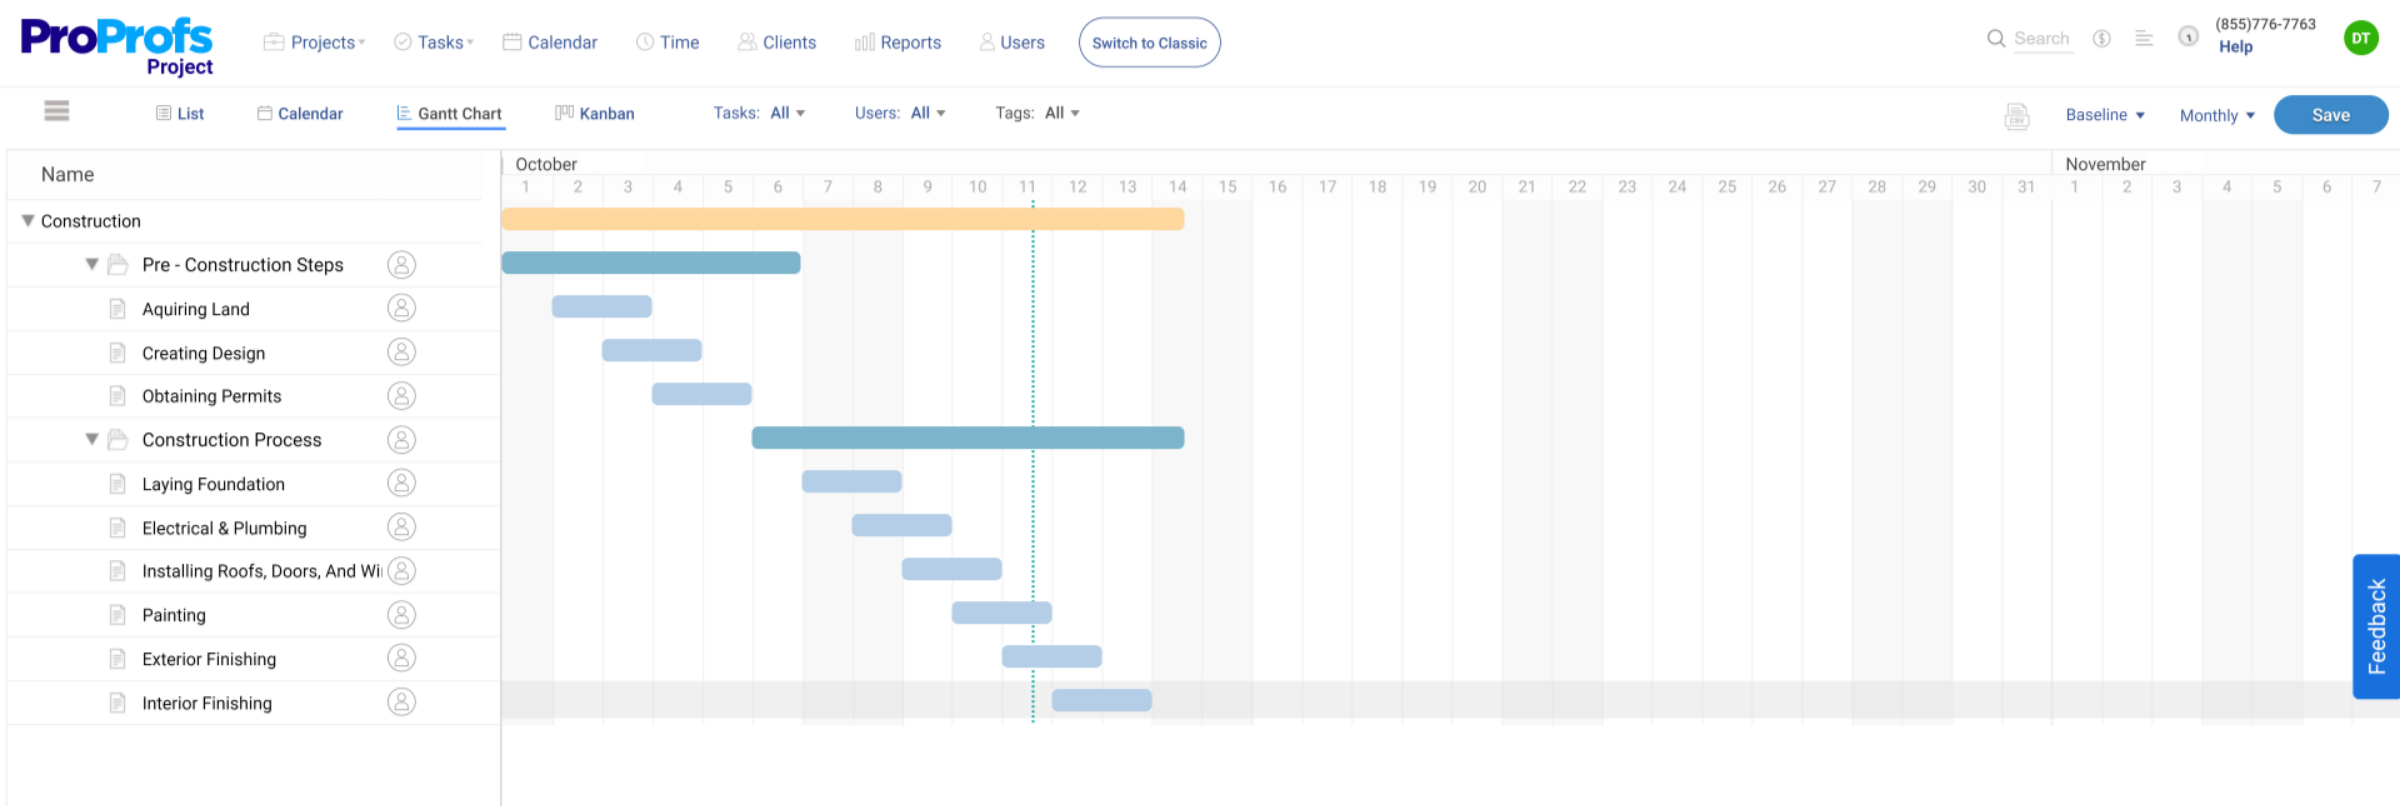
This level of organization is critical for keeping construction projects on schedule and within budget.
Use Cases by Industry
- Residential Construction: Manage timelines for design, permitting, excavation, framing, utilities, and final inspections.
- Commercial Real Estate Development: Coordinate architectural planning, zoning approvals, contractor scheduling, and tenant build-outs.
- Infrastructure & Civil Engineering: Track phases of roadworks, bridges, utilities, and environmental compliance tasks.
- Industrial Facility Construction: Oversee large-scale factory builds, equipment installation, safety checks, and systems commissioning.
- Interior Design & Renovation: Schedule demolition, design approvals, material deliveries, contractor work, and final styling.
9. Social Media
Being part of a social media team is not for the faint-hearted (brutally honest review).
You have to manage posts, create content calendars, track campaign launches, check why engagement rates are falling, and more. But all this chaos can be silenced (to some extent) when you maintain a consistent posting schedule across platforms. How?
Well, social media managers say Gantt charts greatly help them in this.

Using Gantt charts, you can plan posts and campaigns across different platforms, ensuring a strategic approach to c
Using Gantt charts, you can plan posts and campaigns across different platforms, ensuring a strategic approach to content delivery. It also aids in allocating resources for content production and monitoring, optimizing the impact of social media efforts.
Use Cases by Industry
- E-commerce & Retail: Plan product promotions, influencer collaborations, content calendars, and seasonal campaign rollouts.
- Entertainment & Streaming: Schedule show announcements, trailer drops, behind-the-scenes content, and fan engagement events.
- Travel & Hospitality: Coordinate destination spotlights, guest experiences, seasonal offers, and travel influencer takeovers.
- Beauty & Fashion: Manage product launches, tutorials, influencer content, and cross-platform brand campaigns.
- Education & Online Learning: Organize enrollment campaigns, webinar promotions, student success stories, and course highlights.
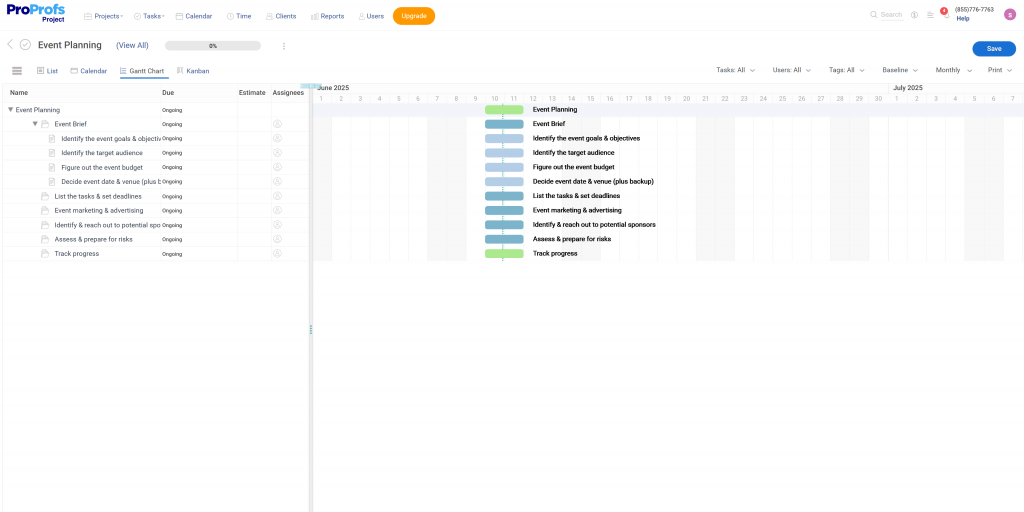
10. Event Planning
Event planning is an intricate mix of logistics, from venue booking to vendor coordination and guest management.
A Gantt chart provides event planners with a visual checklist of every task and deadline, ensuring nothing is overlooked. Whether a corporate conference or a charity gala, the chart helps manage the myriad details, guaranteeing a successful event.
For example, in the image below, you can see that a Gantt chart divides the event into numerous tasks, such as budgeting, setting dates, and organizing decorations.
Use Cases by Industry
- Corporate & Business Services: Organize conferences, product launches, networking events, and internal company meetings.
- Nonprofits & Charities: Plan fundraising galas, awareness campaigns, donor events, and volunteer coordination.
- Education & Academia: Schedule graduation ceremonies, academic conferences, student orientations, and faculty events.
- Hospitality & Tourism: Coordinate weddings, banquets, destination events, and seasonal festivities at hotels or resorts.
- Entertainment & Media: Manage concerts, film festivals, award shows, and promotional tours with detailed timelines.
11. Consultants
If you are a consultant working on client projects, Gantt charts can help you outline project phases, deliverables, and deadlines—providing a clear roadmap for the client.
This helps clearly communicate the project plan to clients, setting realistic expectations for completion.
It also enables you to juggle multiple client projects efficiently, ensuring each project receives the attention it needs without compromising quality or timelines.
Use Cases by Industry
- Management Consulting: Map out strategic planning, process audits, stakeholder workshops, and final report delivery for clients.
- IT & Systems Consulting: Schedule requirement gathering, software implementation, system testing, and client training phases.
- Marketing & Branding Consulting: Coordinate market research, brand audits, campaign planning, and content rollout schedules.
- Financial & Compliance Consulting: Plan financial assessments, risk analysis, documentation reviews, and compliance reporting.
- HR & Organizational Development Consulting: Track recruitment audits, training program development, policy updates, and performance review planning.
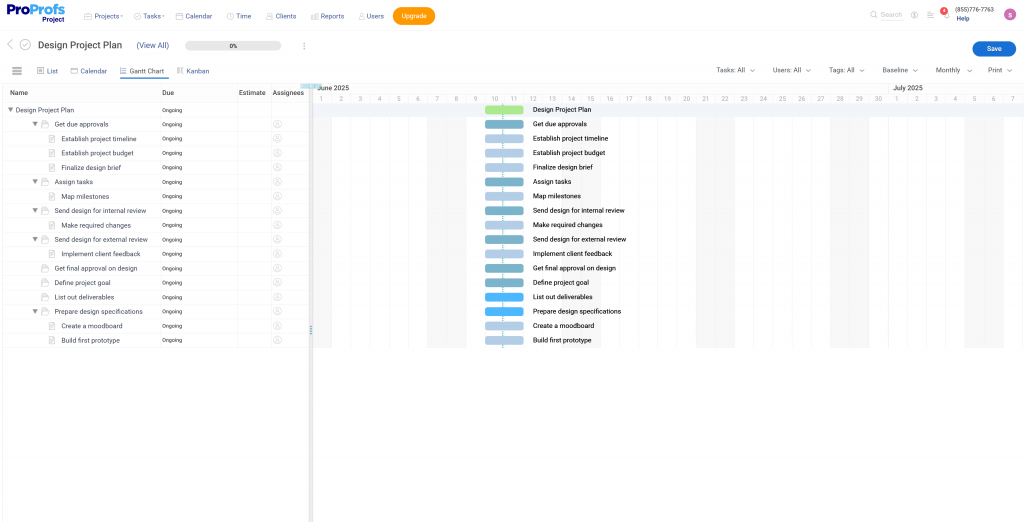
12. Design Project
A Gantt Chart helps track creative processes, review cycles, and implementation stages in creative projects such as website design or branding campaigns. Most tasks in these projects are interdependent.
For instance, if you’re designing a new website, you’ll most likely follow a well-established procedure:
- Create a wireframe for the user interface
- Make a mockup in Photoshop
- Create a webpage
- Test Website
With the help of a Gantt chart, your design team can track all these steps in one place. Here’s an example –
Use Cases by Industry
- Web & UX/UI Design Agencies: Plan wireframing, prototyping, visual design, client feedback, and website deployment.
- Marketing & Creative Studios: Manage branding projects, graphic design tasks, asset creation, and multi-platform campaign rollouts.
- Advertising & Media: Schedule ad concepting, visual production, revisions, approvals, and campaign delivery timelines.
- E-commerce & Retail: Organize product photography, packaging design, store layout updates, and promotional material creation.
- Software & App Development: Coordinate interface design, component mockups, user testing, and integration with development workflows.
13. Mobile App Development
Using a Gantt chart, you can plan the steps needed to develop your app. It visually represents the agile development process, including development sprints, feature implementation, testing, and launch.
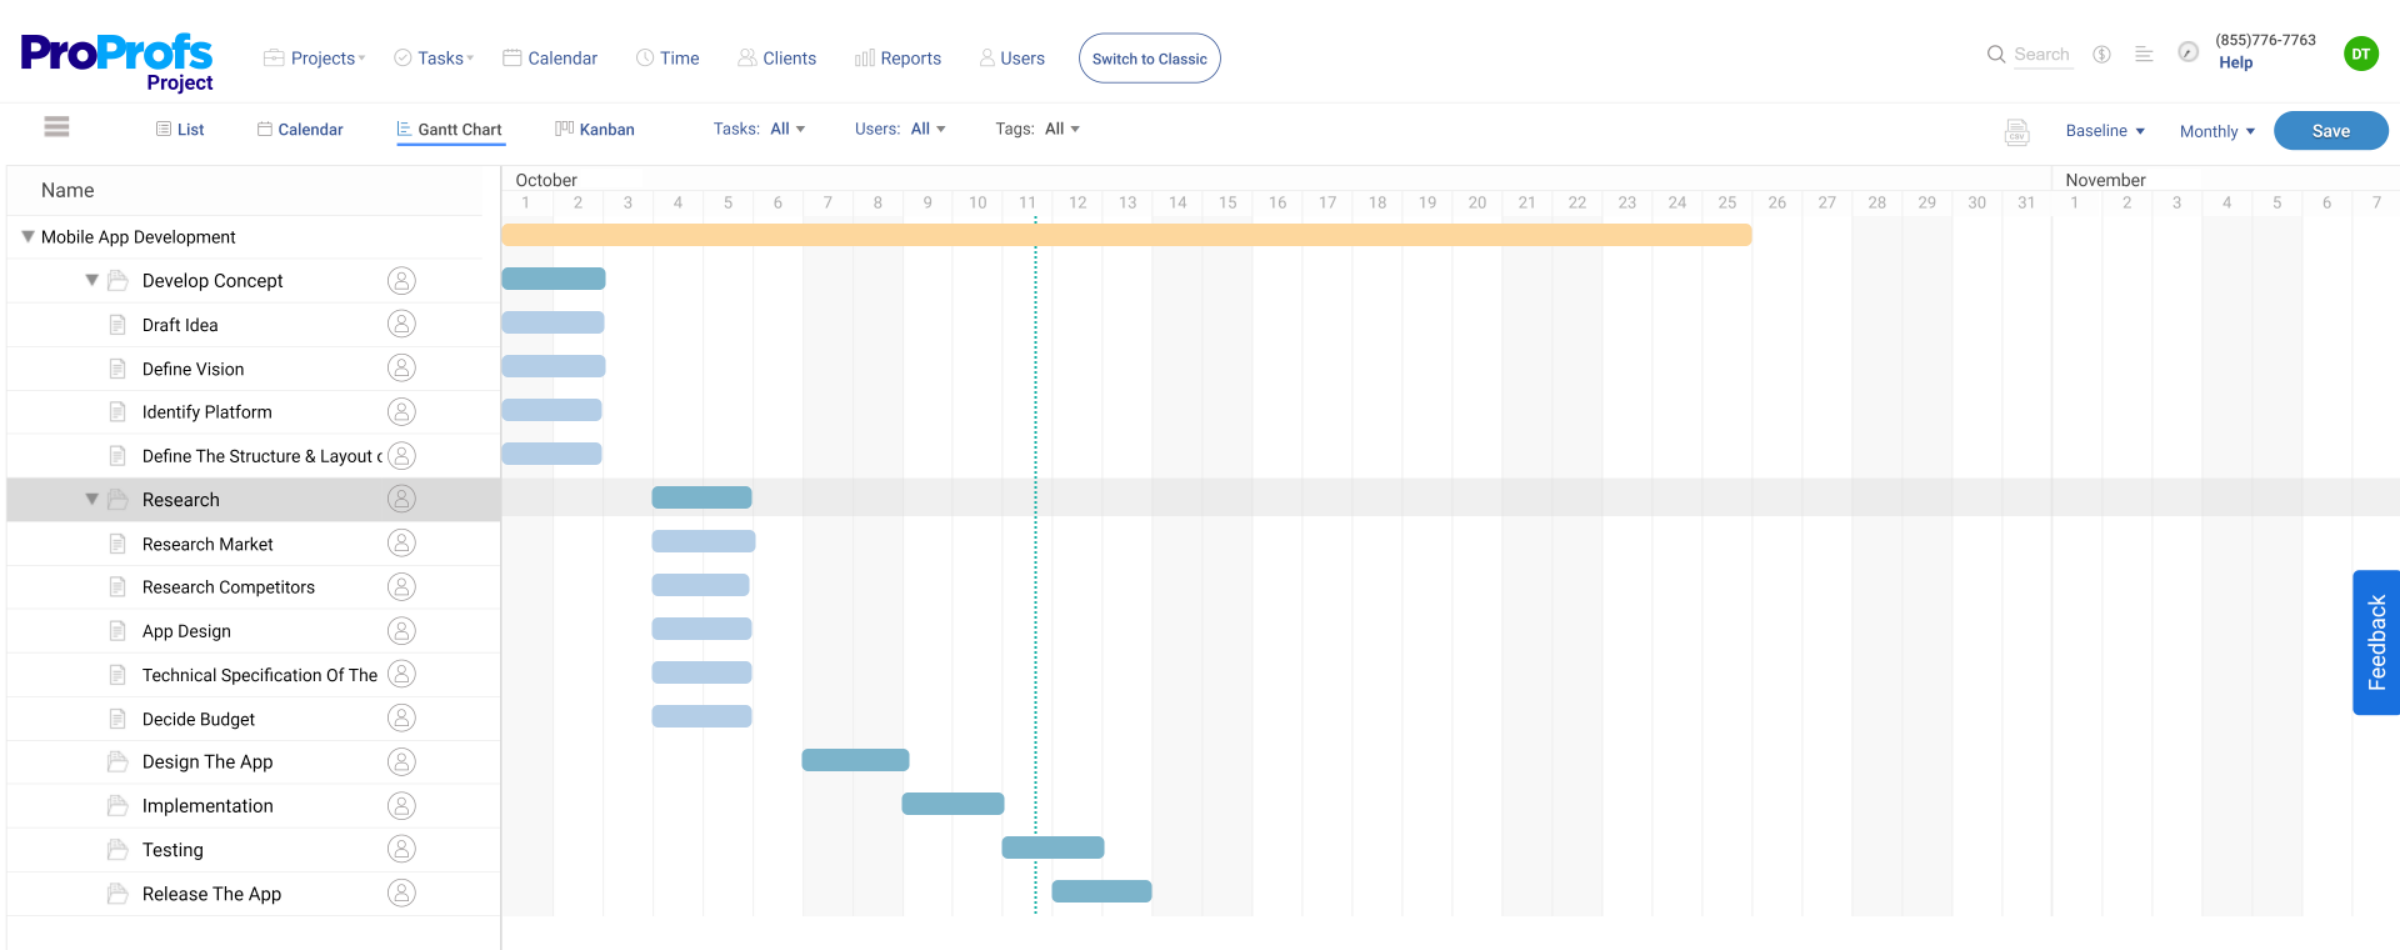
It also boosts your likelihood of finishing each task accurately and efficiently. After all, the goal is to ensure a successful app launch, and this method helps you achieve that goal.
Use Cases by Industry
- Technology & SaaS: Plan development sprints, feature rollouts, beta testing, and app store deployment for digital products.
- E-commerce & Retail: Coordinate mobile storefront development, payment integration, UX optimization, and promotional updates.
- Healthcare & Wellness: Manage app features for appointment booking, health tracking, data security, and HIPAA compliance testing.
- Finance & FinTech: Schedule secure transaction features, multi-factor authentication, compliance testing, and release phases.
- Travel & Hospitality: Organize booking functionalities, real-time updates, loyalty features, and multilingual support development.
14. Email Marketing
Like social media, email marketing requires robust efforts to plan and execute campaigns efficiently. There’s a lot to track – which content is performing well, which is not, dates, times, contacts, subjects, and more.
The idea behind using a Gantt chart here is to remain on top of everything. Otherwise, failing to monitor all email-related tasks and contacts could result in missed sales opportunities and lost valuable connections and leads…something like this –
Use Cases by Industry
- E-commerce & Retail: Plan promotional emails, abandoned cart campaigns, seasonal offers, and product launch announcements.
- SaaS & Technology: Schedule onboarding sequences, feature updates, renewal reminders, and upsell campaigns for subscribers.
- Education & Online Learning: Coordinate course announcements, enrollment reminders, student engagement series, and feedback requests.
- Travel & Hospitality: Manage booking confirmations, seasonal travel deals, loyalty program updates, and itinerary emails.
- Nonprofits & Fundraising: Organize donation drives, volunteer outreach, impact updates, and thank-you campaigns.
15. Software Development
Gantt charts are a dream come true for software development teams. Why?
These charts facilitate the tracking of version releases, feature developments, testing cycles, and bug-fixing efforts – aligning the development team and stakeholders around a common timeline.
Using a Gantt chart in software development projects, you can oversee –
- Project management tasks
- Planning of activities
- Development
- Implementation
- Testing
- Deployment and maintenance
Use Cases by Industry
- Technology & SaaS: Track sprint cycles, feature rollouts, version updates, and deployment timelines for cloud-based solutions.
- E-commerce Platforms: Manage backend integrations, UI improvements, checkout features, and mobile responsiveness updates.
- Finance & FinTech: Plan secure coding phases, compliance testing, digital wallet integration, and regulatory updates.
- Healthcare & Medical Tech: Schedule patient data system development, HIPAA-compliant testing, and app feature implementations.
- Telecommunications: Coordinate software upgrades, network tools development, device compatibility testing, and feature expansion.
Understand task dependencies clearly with these Gantt chart examples. Full guide on managing them: Gantt Chart Dependencies.
How to Create a Gantt Chart – Easy Step-By-Step Process
Creating a Gantt chart in Excel, PowerPoint, or Word is possible but often time-consuming, complex to update, and unsuitable for team collaboration.
That’s where ProProfs Project simplifies things. Here’s how to switch to the Gantt chart view in minutes:
Step 1: Set Up Your Project & Tasks
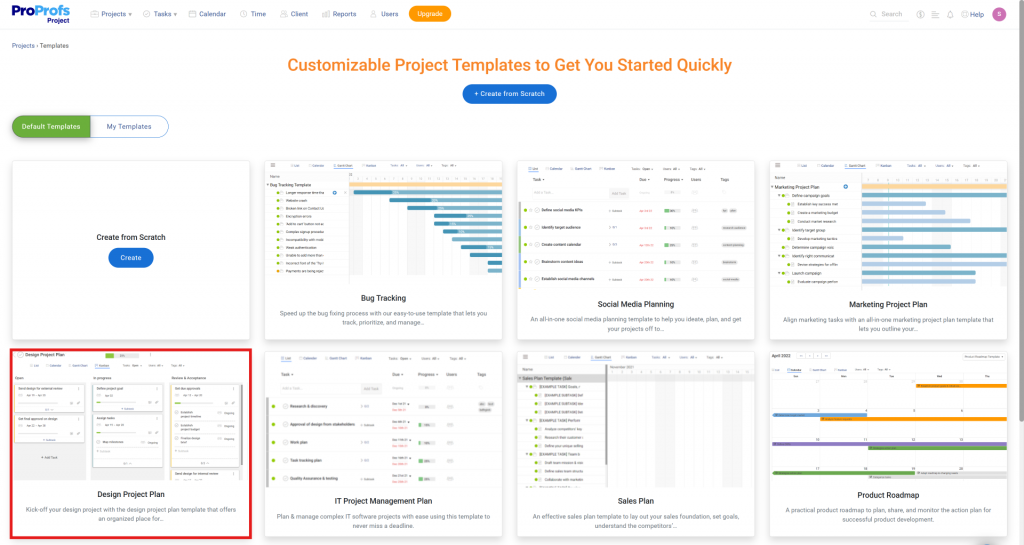
Honestly, you should use templates for repeatable workflows like onboarding, audits, or campaigns—to save time and ensure consistency across recurring projects.
Step 2: Switch to Gantt Chart View
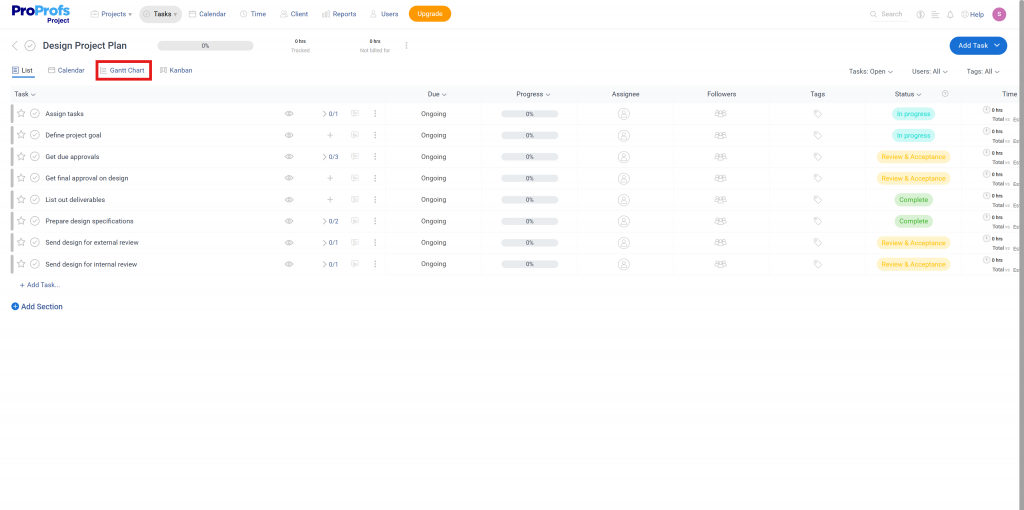
By default, you will see a Task List View. To switch to the Gantt Chart view, click “Gantt Chart” in the top bar. This will instantly give you a visual timeline that’s easier to digest than Excel rows and perfect for tracking dependencies.
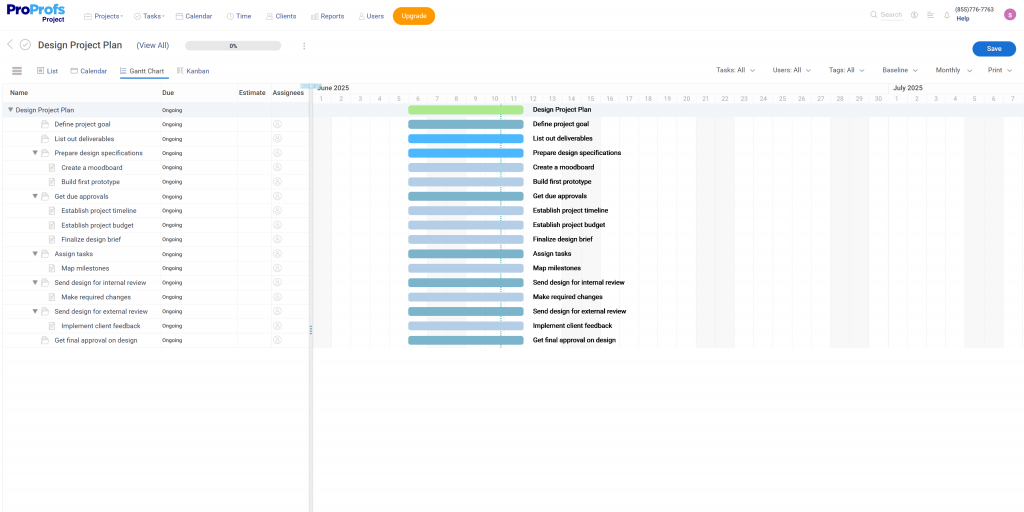
On the left, you’ll see the project name with its tasks and subtasks listed vertically. Each is shown as a blue progress bar, indicating its start date, end date, and duration, deal for fast planning and team-wide visibility.
Step 3: Organize Each Task
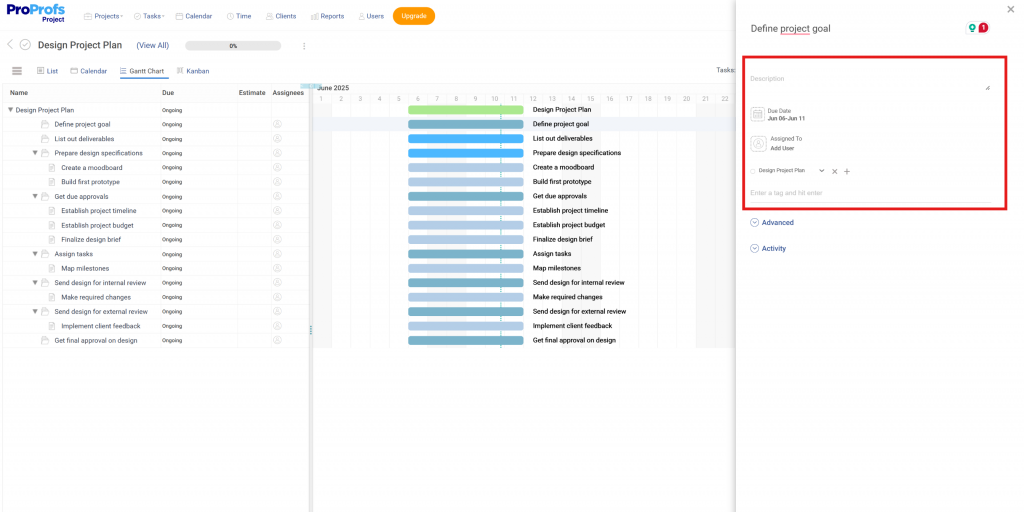
Add task details like description, due dates, assignees, and progress by clicking on a task to keep everything organized and up to date.
Remember to keep task names action-oriented (e.g., “Design Homepage Wireframe” instead of just “Homepage”)—this enhances clarity across teams.
Step 4: Set Task Properties to Streamline Workflow
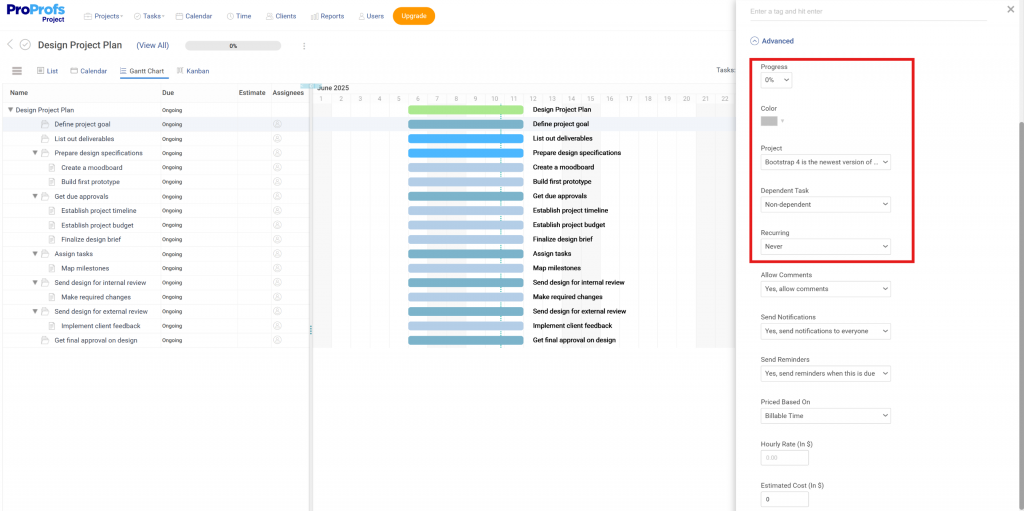
In the task dashboard, define progress, color-code, assign to a project, link dependencies, and set recurrence, so your team stays organized and on track from start to finish.
This will help you avoid bottlenecks and maintain alignment across multiple departments or projects.
Step 5: Enable Task Alerts
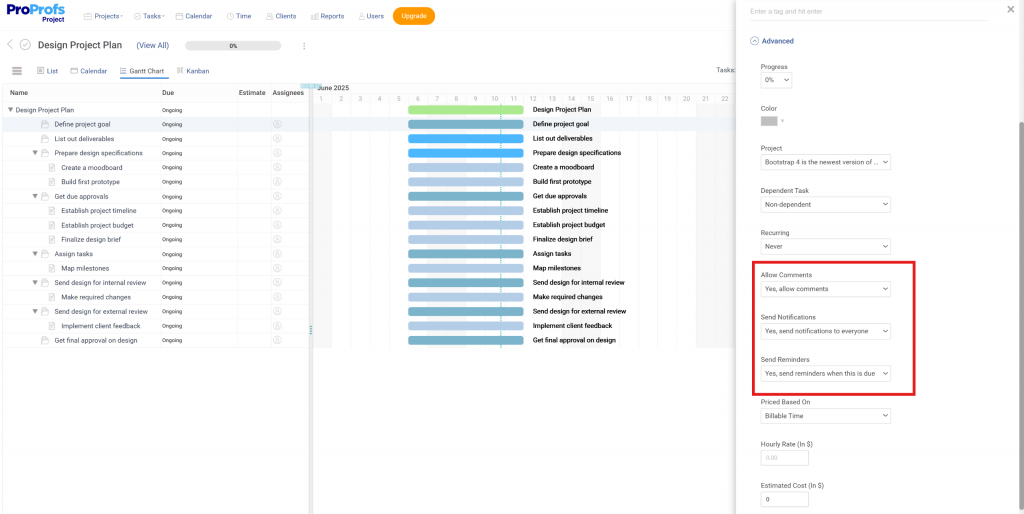
Click on each task to turn on comments, notifications, and reminders. This will ensure that your teammates get timely updates, reducing delays and improving team communication.
Don’t forget to tag team members in task comments to loop them in directly. This reduces back-and-forth emails and keeps conversations task-specific.
Step 6: Add Estimates to Track Budget & Time Efficiently
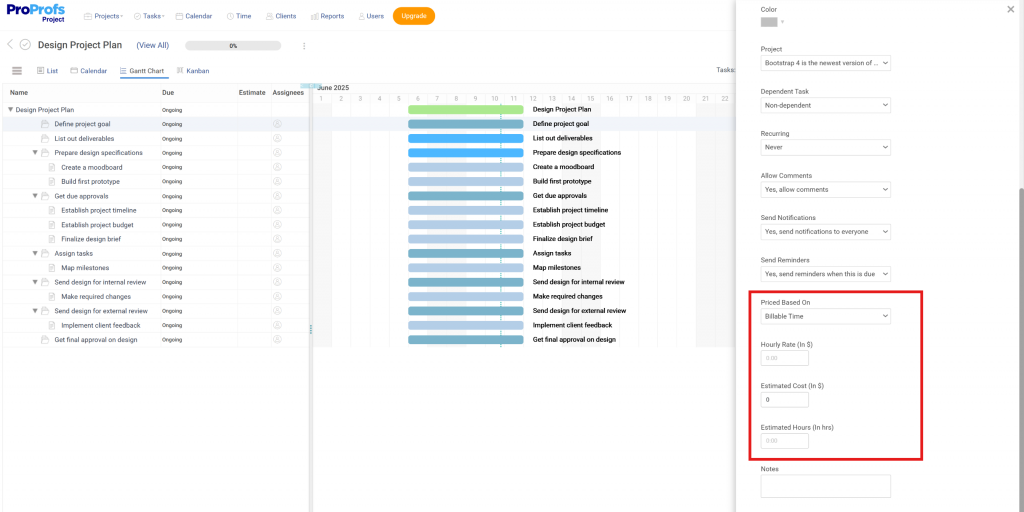
Inside the task dashboard, input billing details, estimated hours, and costs to forecast expenses and manage time. This will replace disconnected spreadsheets and help you forecast resources more accurately.
What Are the Parts of a Gantt Chart?
Understanding the key components of a Gantt chart can help you visualize project timelines, track dependencies, and assign tasks clearly.
This makes streamlining both simple and complex workflows easier. Let’s check them out!
- Task List: This is a list of all the tasks or activities that need to be completed for the project. Having a list makes it easy to assign tasks clearly to team members, especially in collaborative or cross-functional projects.
- Milestones: The chart marks key milestones or major project checkpoints as significant events. These help teams stay aligned on major deliverables and enable standardized planning for repeatable workflows.
- Dependencies: Arrows or lines show task dependencies, indicating which tasks need to be completed before others can start. This is particularly useful for complex workflows in construction, media, or engineering, where task order and timing are critical.
- Timeline: A horizontal timeline represents the project duration, with each task displayed as a bar along the timeline. This view makes it easier to track progress, identify delays, and adjust schedules proactively.
This Gantt chart example shows exactly how to use a Gantt chart for dependencies and milestones. Full tutorial: How To Make a Gantt Chart in 2026.
Apart from the four main parts of a Gantt chart, there are also some other parts that you should know about:
- Bars: Each task is represented by a bar on the chart, with the bar’s length indicating its duration. Color-coding can help you spot task types, owners, or project phases at a glance.
- Duration: The bar’s length helps visualize how long a task will take, which is useful for spotting overloads or overlaps across multiple projects.
- Percent Complete: This shows how far along each task is, which is ideal for keeping teams aligned and giving stakeholders quick visibility into progress.
- Resources: Gantt charts can display who or what is assigned to each task, helping you plan better and avoid overloading people or tools.
- Critical Path: Highlights tasks directly impacting your project timeline, great for identifying early bottlenecks.
- Baseline: It lets you compare your actual progress with your original plan, which is especially handy for tracking changes in scope or schedule.
- Notes or Comments: Add context or instructions directly to tasks, which is helpful for remote teams or when handing work off across departments.
- Legend: This section explains symbols or color codes. It is valuable when sharing charts with clients or new team members.
What Are Some of the Pros & Cons of Using Gantt Charts?
I know you’re probably wondering – Pros are okay, but why would there be cons of using Gantt charts? Don’t they have a lot of use cases?
Well, like any tool, even Gantt charts have their advantages and disadvantages. Even if the cons aren’t deal-breaking, it’s better to be aware. Here are some of the most common pros and cons –
Pros:
- High-Level Overview: Gantt charts show the full project timeline. They make it easy to see the order and length of tasks. This helps teams manage multiple clients or departments.
- Resource Management: They help assign people and resources to tasks. This improves visibility and avoids overloading teams. It’s beneficial in fields like engineering and food production.
- Tracking Progress: They allow for real-time tasks, benchmarks, and workflow tracking. If its a cloud tool, your tasks will be updated automatically. This saves time and reduces manual work.
- Illustrating Dependencies: They show how tasks are linked. You can see which tasks depend on others. This prevents delays in complex projects like construction or software development.
Cons:
- Complexity: Gantt charts can become too complex and difficult to interpret as projects grow.
- Information Overload: Gantt charts can overwhelm you with too much information if poorly designed.
- Maintenance: They require constant updates to reflect the project’s true status, which can be time-consuming.
Create Effective Gantt Charts That Reduce Your Workload
Gantt charts are undoubtedly an indispensable tool if you manage projects with multiple tasks, assignees, dependencies, etc. It can help you make scheduling, planning, and tracking projects easier than before.
But there’s a prerequisite – you must have reliable Gantt chart software.
That’s largely because creating these charts on spreadsheets or Word documents is a hassle. With a software solution, there’s hardly any sweat.One such popular software that offers an intuitive Gantt chart maker is ProProfs Project.
It’s an easy-to-use project management software you may have heard before. You can give it a test drive – it’s completely free, thanks to the freemium plan.
Frequently Asked Questions

How can I share Gantt charts with clients without giving full access?
Yes, in ProProfs Project, you can share Gantt charts with clients via a secure URL, letting them view progress without full access or edit rights.
Can Gantt charts be used for personal projects or research planning?
Absolutely! It is flexible enough for personal use, like research, writing, or goal tracking.
FREE. All Features. FOREVER!
Try our Forever FREE account with all premium features!