“Can you brief me about the progress on that project?”
“Oh, was there a defined due date for the task?”
“Well, I was too busy to grasp how the project was moving forward.”
Do you often experience such things at the workplace and can’t help but deal with these issues that affect the quality and progress of a project?
There are Advantages and Disadvantages of Using Gantt Chart. Exploring what a Gantt chart is and how it can help you visualize all your project tasks can make things easier for you. A few clicks, one glance at the dashboard, and you can instantly gather all information related to your project.
It helps you plan and accomplish projects within the specified timeline, ensuring you stay on top of your projects round-the-clock. With its interactive bar chart, you can monitor start and end dates, track milestones, and know who is working on what from anywhere, anytime.
What Is a Gantt Chart?
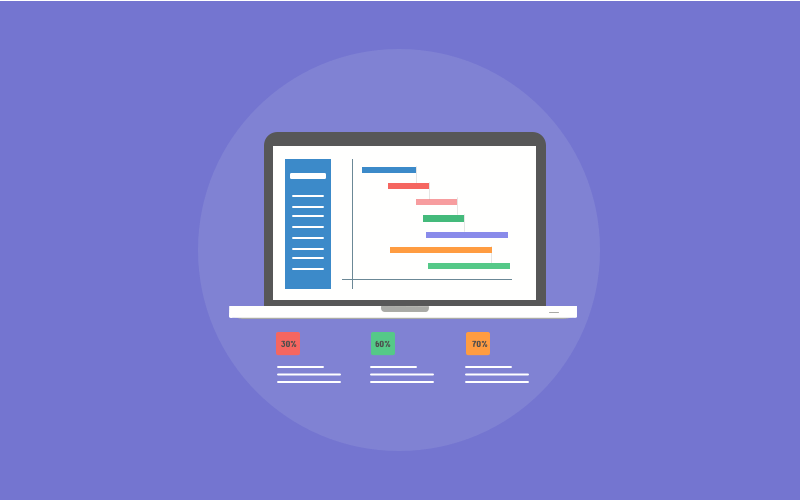
A Gantt chart is a visual representation of the project tasks and activities scheduled over time. It supports you in planning projects and lets you visualize progress in real-time.
Typically, a Gantt chart consists of a list of tasks on the left and horizontal progress bars on the right. The colorful progress bars display a task’s start and end dates and indicate the percentage of work completed within a task.
Now that you know what a Gantt chart is, let’s move on to understand its importance.
Why Is a Gantt Chart Important?
Gantt charts are widely used for centralizing projects and collating all project data into one place. It illustrates the lifecycle of a project, right from its initiation to closure, providing real-time status of each task and subtask.
Another key purpose of a Gantt chart is that it helps measure the scheduled timeline against the actual one with the help of a baseline. This enables you to assess the actual time and effort required to complete a task, ensuring that you create accurate timelines in the future.
Using a Gantt Chart, you can:
- Organize and schedule tasks
- Define task durations and task dependencies.
- Give and receive feedback/suggestions via task comments
- Set reminders for upcoming tasks
- Store and manage files for easy access
- Set milestones and track progress effectively
- Establish clear task responsibilities by assigning tasks to users
The list can go on! You can enhance the use of Gantt chart by leveraging several features available in a tool. Undeniably, the Gantt chart has proven benefits to its name.
Ah, ‘name’ takes us back to where the term Gantt chart came from! So let’s quickly look into the history of Gantt charts.
Who Needs a Gantt Chart?
Anyone looking to understand their project schedules better can deploy a Gantt chart. It is one of the simplest ways to plan and visualize tasks, resources, and deadlines in one place.
Since most of the difficult work (designing the chart) is carried out by software applications, most people can use Gantt charts to create simple to-do lists with start and end dates.
However, most organizations use it to manage much more complex projects and get an instant overview of the project status, associated tasks.
So, whether you’re a CEO, a project manager, an HR manager, or a designer, you can deploy a Gantt chart in project management right away!
Also, you can use a Gantt chart across industries such as manufacturing, business, public service, construction, etc.
Refer to these Gantt chart examples to learn more about how to make a Gantt chart effectively.
We’ll now explore the advantages and disadvantages of a Gantt chart.
Advantages of Using the Gantt Chart
A Gantt chart is a powerful tool with significant advantages for manage multiple projects like a pro. The advantages and disadvantages of Gantt charts become clear when managing Gantt chart dependencies.
Let’s look at a few advantages of the Gantt chart in project management.
1. Interactive Data Visualization
A Gantt chart offers the easiest way to create and visualize project schedules, bringing transparency into everyday workflows. Its bar charts allow you to measure project progress in a quick overview. By representing the entire project schedule, the visual tool helps identify task relationships and Gantt chart dependencies at a glance.
2. Efficient Time Management
You can save time and effort simultaneously with a crystal clear Gantt chart timeline that helps you track tasks, milestones, and deadlines accurately. This way, you gain perspective on how the project is progressing. Also, you get insights into whether you need to intervene in the set workflow to adjust the task deadlines for the best possible project outcome.
3. Effective Resource Allocation
With Gantt charts, you can optimize resource allocation so that the right resources are allocated to the right task throughout the life cycle of a project. It also helps avoid resource overload, ensuring the best utilization of resources according to their unique capacity.
4. Enhanced Team Productivity
Building a Gantt chart on a centralized platform helps improve team communication and collaboration. Work is transparent, and workflows are in perfect sync with each other. With this, team members enjoy seamless interaction for project tasks and activities, enabling enhanced team productivity and superior project results.
Read Also: 7 Ways to Increase Your Productivity
5. Helps Manage Multiple Projects Simultaneously
What can be better than having all your projects’ data clearly fed and managed from one platform? This is exactly what a Gantt chart does! It distinctly stores data of all your projects on the Gantt chart timeline, and you can access this data from anywhere and anytime.
Read Also: How to Manage Multiple Projects at Work
6. Helps Set Realistic Deadlines & Project Expectations
With its accurate data visualization, a Gantt chart allows you to set clear deadlines that help you achieve work on time. Also, this helps you monitor project progress. This further ensures that you reach the project finish line within the set timeframe without compromising the project quality.
7. Aids Faster & Better Decision-Making
The Gantt charts provide an easy overview of all project data, making decision-making informed and accurate. Thus, the tool is a respite for project managers and stakeholders alike. This allows you to analyze and plan future projects with a clear understanding of how existing projects are progressing.
8. Helps Manage Remote Teams Successfully
Gantt charts are the most straightforward way remote teams can collaborate and achieve a shared goal. It provides a space where remote team members can effectively track, coordinate, and stay updated on their key tasks and responsibilities. This helps them stay on top of projects and deliver expected project outcomes smoothly, despite being geographically dispersed.
9. Creates Transparent Work Environment
By making beautiful Gantt charts that are easy to read, team members enjoy transparency in the everyday workflow of projects. And, with increased transparency comes better communication and engagement, enabling an easy flow of daily tasks. This way, you can accomplish multiple projects simultaneously without having to approach co-workers for the minutest project details throughout the project’s life cycle.
10. Fosters a Sense of Accountability
A Gantt chart defines the stage of completion of a project. It also explains which resources are allocated to which tasks and what is the timeline of a specific project. Having the entire project status clearly laid out on interactive Gantt charts helps establish a sense of accountability. It instills ownership in team members and gears them to achieve set goals and objectives promptly and efficiently.
Thus, Gantt charts are the ideal way to pan out a project. From defining the project execution process to analyzing work progress, you can visualize everything using a Gantt Chart.
That’s not all. You must also be aware of the limitations of the Gantt chart to deploy it for your project and team correctly.
Disadvantages of Using a Gantt Chart
Without further ado, let’s look at the disadvantages of a Gantt chart.
- Building a Gantt chart can get tedious – Creating, assigning, and prioritizing multiple projects can get tedious and unnecessarily time-consuming for large and complex projects.
- Access to the software is mandatory – Without access to the software, it is impossible to update, assign, track, or schedule a Gantt chart with project tasks and activities, causing a technological barrier midway through project execution.
- Maintaining bar charts for complex projects is not ideal – When a project requires setting up and working with too many tasks and subtasks, managing the project can often go for a toss.
Like everything, the Gantt chart too has its shortcomings. You must assess whether its shortcomings will hinder Gantt chart planning for you or cause your project to topple during project execution sooner or later.
Overcome the disadvantages of Gantt charts by choosing the best Gantt chart software. Top recommendations: Best Gantt Chart Software & Tools for Real-Time Tracking.
Must-Have Features of the Best Gantt Chart Software Tool
The right tool offers some hard-to-miss features. Consider these features while selecting the best Gantt chart software for your business.
- Easy to set up – An ideal Gantt chart is easy to set up. If a tool is difficult to set up, you, as a project manager, and the team members will be discouraged from using the tool every day.
- Clear-cut timelines – A Gantt chart is visually appealing. It offers task timelines that indicate the start and end dates.
We’ll take the example of ProProfs Project to help you understand the functionality better.
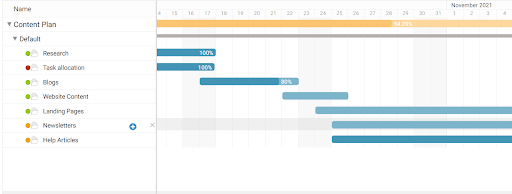
This is what a Gantt chart looks like in ProProfs Project. The vertical column highlights the various tasks of the project. The blue bars next to these task titles indicate the task timeline. The orange bar indicates the timeline of completing the entire project, ‘Content Plan.’
- Transparent resource allocation – The Gantt chart lets you view tasks by sorting the view by Users. So, you can select a user, and the chart will show all tasks assigned to that user.
- Quick customization ability – A good Gantt chart software lets you customize workflows on the go. So you can move, stretch, and contract task timelines with a simple drag-and-drop action across the chart. You can also edit task details by clicking either the task bars or the task titles. This will open a side window, and you can change settings as required.
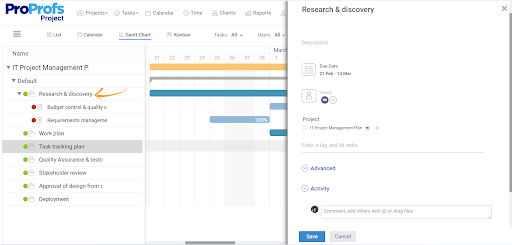
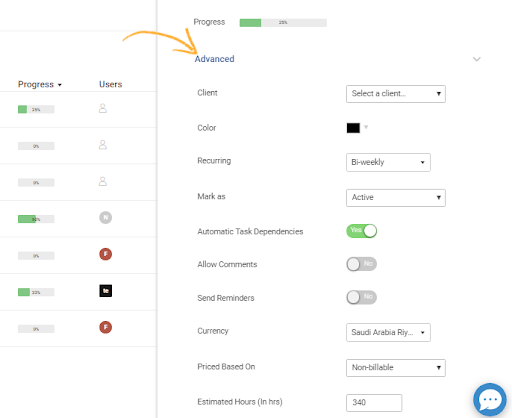
- Advanced settings – While using a Gantt chart to manage projects, you must also use advanced capabilities such as color, reminders, and recurring. These settings help personalize tasks to suit your unique needs.
- Task Tracking – Gantt chart software allows you to grasp task status at a glance. In ProProfs, a green circle next to the task title indicates an active (or ongoing) task. The orange circle indicates an on-hold task, and the red circle indicates an inactive task. Also, you can change this status by clicking on the circle.
Stay on Top of Your Projects with a Solid Gantt Chart
So now that you’re familiar with what a Gantt chart is and how to use one to extract its best advantages, you can build one for your next project and achieve projects on time successfully.
Remember, gaining real-time updates on how your project moves forward is half the battle won. It helps you obtain a real-time perspective of project workflow and prepares you to take corrective action timely in case of any gaps.
Using its colorful and intuitive bar charts that convey the entire timeline of a project within seconds, you’ll never miss a deadline again!
FREE. All Features. FOREVER!
Try our Forever FREE account with all premium features!