I’ve reviewed enough project schedules to say this with confidence: gantt chart dependencies are where most timelines quietly fall apart. Not because a team missed a deadline outright, but because nobody defined which tasks were actually waiting on which, so one small delay turned into a domino effect nobody saw coming.
I’ve sat in the post-mortems where a “two day slip” on one task turned into a two week miss on the whole project, and every single time, the root cause traced back to a dependency that was either missing or set up wrong. It’s rarely a big, dramatic mistake. It’s usually just one predecessor-successor link that got assumed instead of mapped out.
That’s exactly what I want to walk you through here. No jargon, no theory for theory’s sake, just what a dependency actually is, the four types you’ll ever really need, how to set them up in Excel if that’s where you’re starting, and where a spreadsheet stops being enough.
What are Gantt Chart Dependencies?
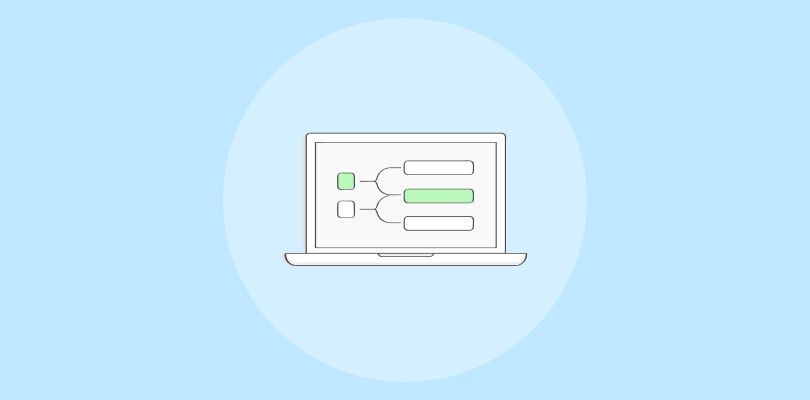
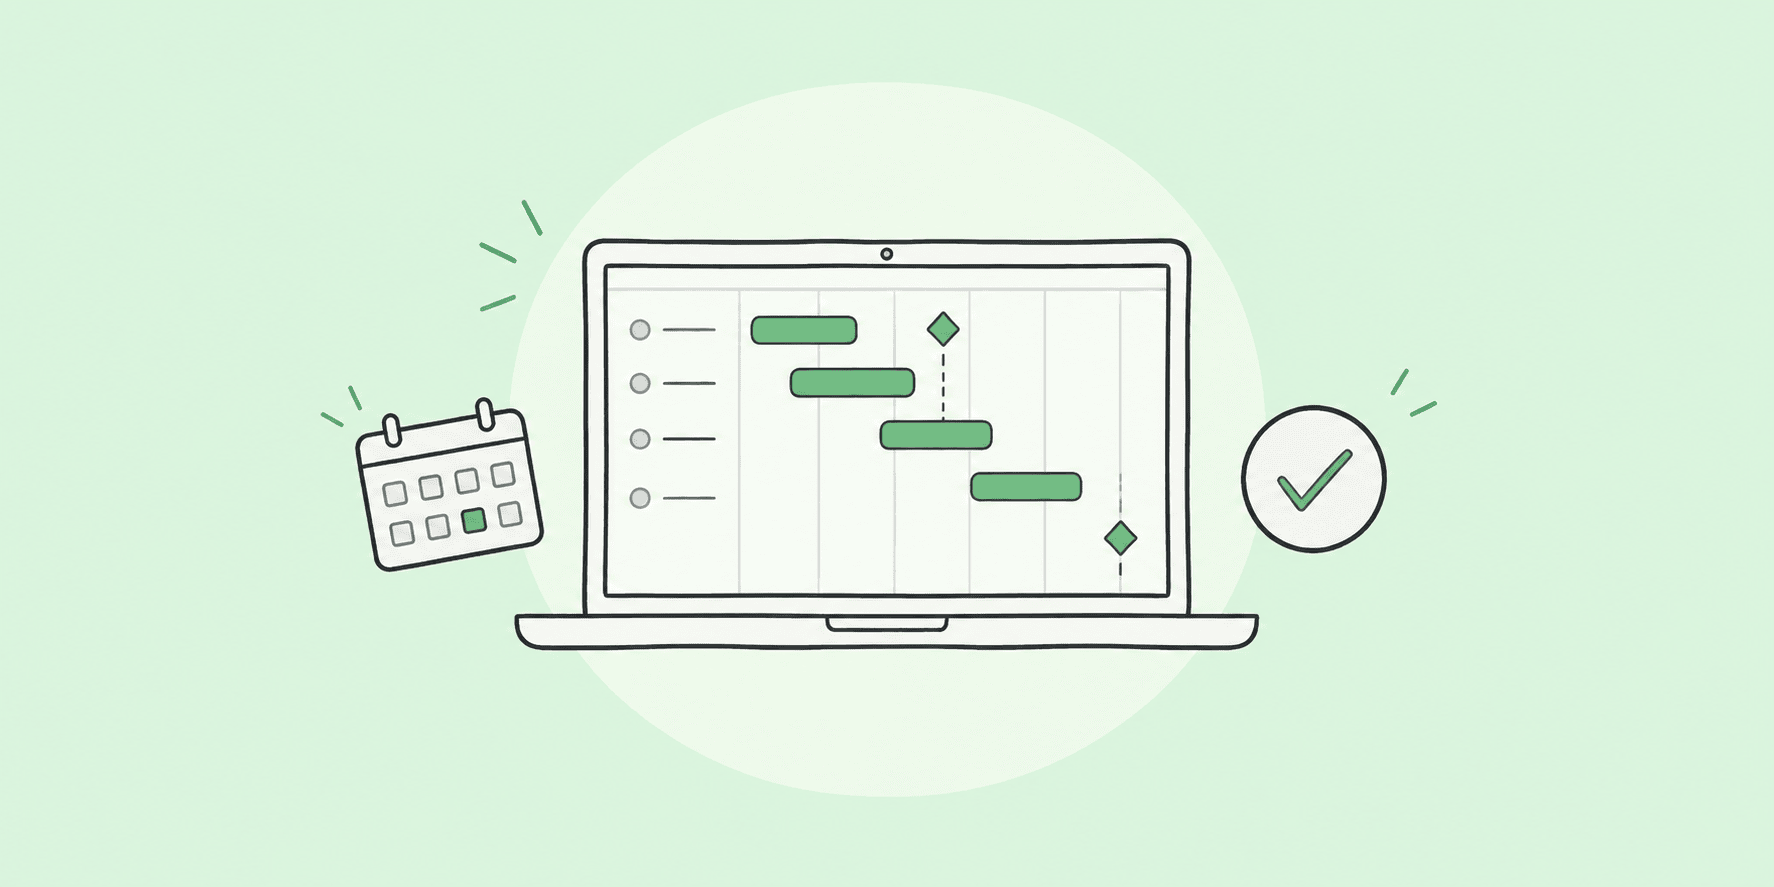
A Gantt chart dependency is the relationship between two tasks that decides their order of work. The task that comes first is called the predecessor, and the task waiting on it is the successor. If you need a refresher on the chart itself first, this breakdown of what a Gantt chart is covers the basics before you get into dependencies.
Here’s what defines a dependency:
- Predecessor – the task that must reach a certain state first
- Successor – the task whose timing depends on the predecessor
- Link direction – shown as an arrow, always pointing from predecessor to successor
- Automatic recalculation – the successor’s dates update when the predecessor’s dates change
Real-world example: a company cannot train employees on new software until that software is installed. Installation is the predecessor, training is the successor. Once linked, moving the predecessor’s date automatically shifts the successor’s date too, the same logic covered in more depth in this guide on task dependencies in project management.
Why it matters: without dependencies, a schedule is just a list of dates that someone has to correct by hand every time something changes. With them, one honest update anywhere in the plan produces an accurate picture everywhere else.
What Are the 4 Types of Gantt Chart Dependencies?
Every dependency in project scheduling falls into one of four categories. Almost every project relies mostly on the first one.
| Type | What It Means | Example |
| Finish-to-Start (FS) | Task B can’t start until Task A finishes | Testing starts only after coding is done |
| Start-to-Start (SS) | Task B can’t start until Task A starts | Writing test cases begins once coding begins |
| Finish-to-Finish (FF) | Task B can’t finish until Task A finishes | Final QA can’t close out until development closes out |
| Start-to-Finish (SF) | Task B can’t finish until Task A starts | The old shift can’t end until the new shift begins |
Finish-to-start makes up most of the links in a typical project plan. If you find yourself reaching for start-to-start or finish-to-finish often, it’s usually a sign the tasks need to be broken down differently, not that the dependency type is wrong.
How Do Predecessor and Successor Tasks Work in Gantt Charts?
Every dependency has exactly one predecessor and one successor, though a single task can act as a predecessor to several successors at once. Think of a kickoff meeting: four different workstreams might all wait on it, so the same task can carry multiple dependency arrows out of it.
- A task can have more than one predecessor (it waits on several things to finish first)
- A task can have more than one successor (several things wait on it)
- The predecessor always controls the timing, the successor always follows it
- Breaking a project into small, clearly scoped tasks makes these relationships easier to spot, which is really the same discipline used in a work breakdown structure
Getting this pairing right matters more than it sounds. Mislabel a predecessor and successor, and the whole chain of dates that follows will be wrong too.
When Should You Use Each Type of Dependency?
- Use finish-to-start for sequential work, like design before build or approval before purchase
- Use start-to-start for tasks that ramp up together, like writing and editing on a rolling basis
- Use finish-to-finish for two streams that need to wrap up in sync, like development and QA closing out together
- Use start-to-finish only for handover situations, like an outgoing shift ending once the incoming one begins
If a task doesn’t clearly fit one of these four, it’s often not a real dependency at all, just two tasks that happen to sit near each other in the plan.
Why do Dependencies Matter for Project Timelines?
Dependencies solve a handful of scheduling problems that a plain task list can’t:
- Unclear order of work – dependencies spell out exactly what has to happen before what
- Invisible ripple effects – a delay on one task automatically shows up on every task it feeds into
- No single source of truth – everyone looks at the same linked timeline instead of asking around
- Guesswork on the finish date – the longest chain of dependent tasks tells you the real end date, not an optimistic one
A study by Wellingtone in 2026 shows only 36% of organizations always or mostly complete their projects on time, and unclear task sequencing is one of the recurring reasons why. Mapping dependencies properly closes one of the most avoidable gaps behind that number.
What is a Critical Path in Project Scheduling?
The critical path is the longest chain of dependent tasks in your plan, and it sets the earliest possible finish date for the whole project. Any delay on a task sitting on this chain pushes your end date back by the same amount. A delay on a task that isn’t on the critical path usually just eats up slack time instead.
This is closely related to what’s sometimes called critical chain project management, an approach built specifically around protecting that longest chain from slipping. Knowing which tasks sit on your critical path tells you exactly where a delay is dangerous and where it isn’t.
How to Add Dependencies to a Gantt Chart in Excel?
Excel doesn’t have a built-in Gantt chart or dependency feature, so you build both using stacked bar charts and formulas. If you’re starting from a blank sheet, this guide on building a project timeline in 6 steps covers the planning that should come before any of this. Here’s the basic process for a gantt chart in excel with dependencies:
- List your tasks in a column, with a Start Date and Duration (or End Date) column next to each one.
- Insert a stacked bar chart using the Start Date and Duration columns. This becomes your Gantt bars.
- Format the bars so the “Start Date” portion is invisible and only the “Duration” portion shows as a colored bar.
- Add a “Predecessor” column next to each task, listing which task it depends on.
- Write a formula in the Start Date column that pulls the End Date of the predecessor task (for example, =IF(D2=””,””,VLOOKUP(D2,A:C,3,FALSE)) for a finish-to-start link).
- Manually adjust the chart every time you add, remove, or reorder a task, since Excel won’t redraw the arrows or bars for you.
- Double-check every formula after edits. A single broken cell reference can silently throw off every task after it.
Expected result: a working excel gantt chart with dependencies where changing a predecessor’s end date updates the successor’s start date. It works, but every new task means touching formulas by hand.
What are Excel’s Limits for Complex Projects?
Excel gets you a functional chart, but the cracks show up fast on anything beyond a simple, single-owner plan:
- No native dependency arrows. You’re building the logic with VLOOKUP or IF formulas, not a real link.
- No automatic critical path. You have to trace the longest chain of tasks yourself.
- No collaboration. Two people editing the same sheet at once is asking for broken formulas.
- No mobile view. Reviewing or updating a schedule from a phone is nearly impossible.
- Formulas break silently. A moved column or a deleted row can throw off dates without any warning.
None of this means Excel is a bad tool, it’s just built for calculations, not for live, shared project timelines with real dependency logic. If you’re weighing options beyond a spreadsheet, this roundup of Gantt chart alternatives is worth a look.
Excel vs ProProfs: Which Wins for Dependency Management?
Most of the gap between the two comes down to how much manual upkeep each one demands versus how much of the task tracking and rescheduling happens on its own.
| Feature | Excel | ProProfs Project |
| Dependency types supported | Manual formulas only | All four types, built in |
| Auto-reschedule on delay | No, edited by hand | Yes, updates instantly |
| Critical path view | No | Yes |
| Real-time collaboration | Limited, version conflicts | Yes, live updates |
| Mobile access | Poor | iOS and Android apps |
| Setup time | Hours, formula-heavy | Minutes, no formulas |
ProProfs Project is intuitive project management software built for teams that want the power of a Gantt chart without the manual formula work. If your team has outgrown spreadsheet workarounds, this is usually the point where switching pays for itself.
What are Common Gantt Chart Dependency Mistakes?
- Linking everything to everything. Not every task in the same phase actually blocks the next one. Over-linking hides real parallel work and turns small delays into full-schedule disruptions.
- Ignoring lag and lead time. Some tasks need a built-in gap or a deliberate overlap. Skipping this makes a schedule look tighter than it really is.
- Forgetting to update dependencies after scope changes. A dependency set at kickoff can go stale the moment priorities shift.
- Never checking the critical path. If you don’t know which chain of tasks actually sets your finish date, you can’t tell which delays are dangerous and which ones don’t matter.
These mistakes tend to compound each other, which is part of why so many teams end up dealing with the same missed deadlines covered in this guide on how to avoid project delays.
What Is Lag Time vs Lead Time in Scheduling?
Lag time is a deliberate gap you add between two linked tasks, like the day of drying time you build in after painting a wall before the next task can start. Lead time is the opposite: it lets a successor task start before its predecessor fully finishes, creating a planned overlap, like starting a first draft while research on later sections is still wrapping up.
Neither one is a formula fix. They’re planning decisions that make a finish-to-start or start-to-start link more honest about how the work actually happens, instead of assuming everything hands off instantly.
Start Building Smarter Project Schedules
Dependencies are what turn a list of dated tasks into a schedule that actually reacts when things change. Excel can get you there for a small, simple plan, but the formulas and manual upkeep add up fast as a project grows.
ProProfs Project draws these dependency links automatically, reschedules everything downstream the moment a date shifts, and gives your whole team one live view of the plan. You can try it free and build your first dependency-linked Gantt chart in minutes, no formulas required.
Frequently Asked Questions
What is a dependency in a Gantt chart?
It's a link between two tasks that controls their order, so one task's start or finish date depends on the other's.
What are the four types of Gantt chart dependencies?
Finish-to-start, start-to-start, finish-to-finish, and start-to-finish. Finish-to-start is by far the most common.
Can Excel show dependencies in a Gantt chart?
Yes, using stacked bar charts and lookup formulas, but there's no native dependency feature. Every link has to be built manually.
How do you add a dependency in Excel manually?
Add a predecessor column next to your task list, then use a formula like VLOOKUP to pull the predecessor's end date into the successor's start date.
What is a critical path in Gantt chart dependencies?
It's the longest chain of dependent tasks in your plan. Any delay on that chain pushes your finish date back by the same amount.
What's the difference between lag time and lead time?
Lag adds a required gap between two linked tasks. Lead lets the second task start before the first one fully finishes.
Why does Excel struggle with complex dependencies?
Because every dependency is a manual formula, not a real link. As task count grows, formulas get harder to maintain and easier to break silently.
What tool is better than Excel for dependencies?
Dedicated project management software like ProProfs Project draws dependency links automatically and reschedules tasks the moment a date changes.
Is ProProfs Project free to try?
Yes, ProProfs Project offers a free plan for up to 3 users, with no credit card required to get started.
FREE. All Features. FOREVER!
Try our Forever FREE account with all premium features!