
Project management is no longer what it used to be; teams are adopting new tools, workflows, and technologies to meet the increasing demands of business.
As we step into 2026, organizations are relying on data more than ever to understand what drives successful projects and where teams struggle.
That’s why tracking the latest project management statistics is essential for leaders to evaluate performance, plan resources, mitigate risks, and select the most effective strategies for their teams.
This guide compiles project statistics and emerging trends that are shaping project execution in 2026. From adoption rates and productivity metrics to technology advancements and budget insights, these numbers provide a clear view of what’s next.
Why Project Statistics Matter for Businesses
Project statistics provide organizations with the clarity they need to plan, execute, and optimize their work with confidence.
Instead of relying on assumptions, teams can use real data to make informed decisions at every stage of a project. Here’s why these insights are essential:
1. Predict risks & roadblocks early: Accurate data helps teams identify delays, bottlenecks, and capacity issues before they escalate, improving overall project stability.
2. Improve resource allocation: By understanding workload patterns, skill availability, and time requirements, businesses can assign resources more efficiently and avoid burnout or underutilization.
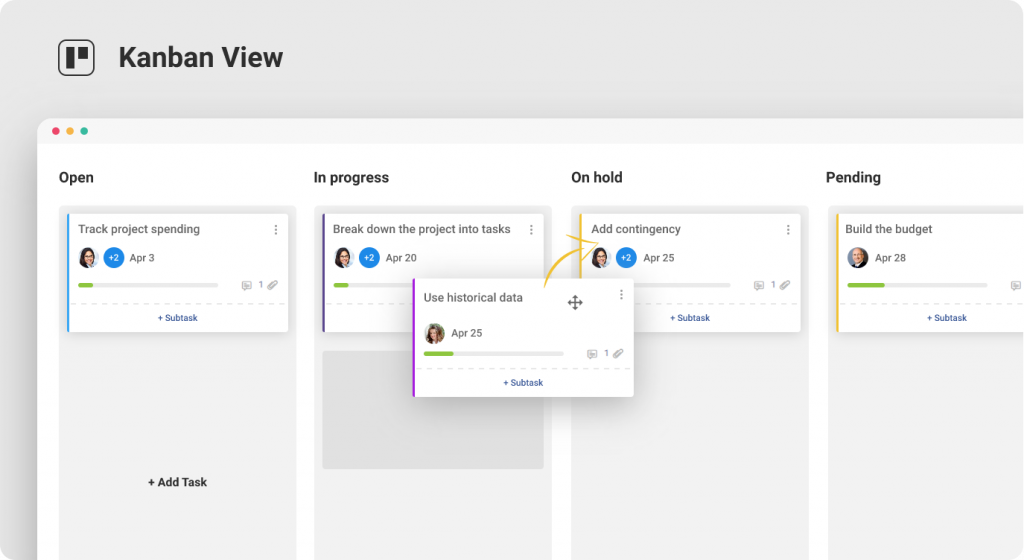
3. Choose the right project management approach: Statistics reveal how different project management methodologies — Agile, Scrum, Kanban, Waterfall — perform across teams, enabling leaders to adopt the framework that delivers the best results.
4. Support budgeting & cost forecasting: Project data highlights spending trends, cost overruns, and financial risks, allowing for more realistic budgets and better financial planning.
5. Track team performance & productivity: Metrics around timelines, quality, and output help managers understand where teams excel and where improvement efforts are needed.
6. Strengthen stakeholder confidence: Reliable data-backed updates make it easier to communicate progress, justify decisions, and maintain transparency throughout the project lifecycle.
Project Management Statistics for 2026
A. Adoption & Usage Statistics
This section discusses the global adoption rates of PM tools, along with the percentage of teams using cloud-based vs. on-premise solutions.
This also discusses the usage trends across enterprises, SMBs, and startups.
1. 61% of project management professionals now work remotely at least part-time (PMI)
2. Hybrid project delivery approaches have grown by 57% in recent years (PMI)
3. Cloud-based project management tools account for 75% of all PM software usage globally (Mordor Intelligence)
4. Only 32% of organizations report high maturity in using standardized project management practices (PMI)
5. Nearly 50% of organizations use a mix of multiple PM tools instead of a single unified system (McKinsey)
6. 44% of teams now rely on AI-assisted project management features such as automated alerts or task suggestions (Deloitte)
7. Agile adoption has reached 94% in software and IT teams (Digital.ai)
8. 33% of organizations have adopted citizen-developer or no-code PM solutions (Gartner)
9. Remote teams are 15% more likely to use lightweight PM tools compared to enterprise suites (PMI)
10. Only 25% of organizations consistently use project retrospectives or post-mortem analysis (PMI)
11. The project management software market was valued at approximately $9.14–9.76 billion in 2025 and is projected to reach around $10.5–11.27 billion in 2026. (Mordor Intelligence)
12. Global demand for project professionals is projected to grow by 64% from 2025 to 2035, creating a potential talent gap of nearly 30 million people. (Project Management)
13. 70%+ of project professionals report their organizations are using or exploring AI in project management. (PMI)
14. By 2026, 80% of PMOs are expected to use AI for decision-making. (PM Study Circle)
B. Productivity & Performance Statistics
This section discusses stats related to missed deadlines, project failures, and cost overruns. It also discusses data on time saved using automation or AI and the impact on delivery timelines.
15. Only 35% of projects worldwide finish successfully, meeting all goals and timelines (PMI)
16. 12% of project investment is lost due to poor performance, amounting to trillions annually (PMI)
17. 66% of organizations report frequent project delays caused by unclear requirements (Wellingtone State of Project Management)
18. 70% of digital transformation projects fail to meet their goals (McKinsey)
19. 55% of projects experience scope creep (PMI)
20. AI automation in project management can reduce administrative work by up to 30% (Gartner)
21. Teams using structured PM tools are 28% more likely to deliver on time (Wellingtone)
22. 45% of project managers spend more than one day per week manually reporting status updates (Wrike Work Management Survey/Cited by Forbes)
23. 29% of projects fail due to poor communication and collaboration (Project Management Institute)
24. Projects using Agile principles improve delivery speed by 20–30% on average (McKinsey)
25. Project professionals with high business acumen achieve 83% business goal attainment (vs 78%), better schedule adherence (63% vs 59%), and lower failure rates (8% vs 11%). (PMI)
26. Only about 31–50% of projects are considered fully successful in 2025, depending on the definition and report (PMI/Standish). (Plaky)
27. High-performing organizations successfully complete up to 89% of projects compared to 34% for underperformers. (Gitnux)
28. AI high adopters report major gains: 91% in quality, 87% in scope, 86% in cost, and 85% in schedule performance. (PMI)
C. Team Collaboration Statistics
This section discusses key team collaboration statistics—from preferred tools and asynchronous trends to remote versus hybrid work dynamics.
29. 35% higher productivity for virtual teams that use collaborative technology (compared with teams that don’t) (WifiTalents)
30. 45% of remote workers say they feel more connected to their team when using collaboration tools (WifiTalents)
31. Teams that communicate effectively are roughly 25% more productive than those that don’t (WifiTalents & Gitnux)
32. 80% of project failures are attributed to poor communication and collaboration (ZipDo)
33. 70% of workers say that the lack of collaboration tools hampers their productivity (ZipDo)
34. 55% of employees report that collaboration disrupts deep focus or concentration (due to overload) (ZipDo)
35. Remote work (fully or hybrid) remains a dominant model: 52% of employees in certain populations report hybrid working arrangements in 2025 (Great Place To Work)
36. Among organizations adopting digital collaboration tools, 25% report a noticeable increase in project completion rates (Moldstud & WifiTalents)
37. 39% of workers cite ineffective collaboration tools or lack of proper tech as a hindrance to teamwork in hybrid or remote setups (Gitnux & ZipDo)
38. 53% of organizations still struggle to foster collaboration among hybrid teams (per a 2025 survey of remote/hybrid work dynamics). (WifiTalents & Gitnux)
39. 73% of organizations expect to increase hybrid project management practices over the next five years. (Project Management)
40. Only 25% of senior leaders perceive remote work as highly effective, highlighting perception gaps. (PM Wares)
D. Budget & Resource Management Statistics
This section provides insights into budget and resource management, covering topics such as cost allocation and shortages, as well as budgeting tools and strategies.
41. A recent academic study of 99 public-building projects (2008–2024) found ≈ 58% of projects experienced cost overruns, and ≈ 78% experienced time overruns. (Preprints)
42. That same study noted that 45.5% of the projects had both cost and time overruns. (Preprints)
43. Another global review of infrastructure projects across many countries reported cost overruns ranging from 19% to as high as 44%, depending on region and project type. (MDPI & Ijraset)
44. For large public-sector IT projects (from a study of 1,355 projects), 18% were identified as “outliers” with cost overruns greater than 25%. (arXiv 01 & arXiv 02)
45. Average cost overrun across projects hovers around 27%, with construction projects showing ~85% overrun rate at an average of 28%. (Budget Overrun)
46. Only about 23–40% of organizations fully leverage dedicated project management software, showing significant adoption potential. (Mosaic)
E. Customer Experience & Outcome Statistics
This section discusses the customer experience and outcome stats, linking project success to satisfaction, revisions, and communication trends.
47. Only 14% of customer service issues are fully resolved in self-service. (Gartner)
48. Approximately 25% of customers will defect after experiencing just one negative incident. (McKinsey)
49. Net Project Success Score (NPSS) average is 36 — stakeholder perception is now central to defining project success. (PMI)
50. Ineffective communications is the primary contributor to project failure one-third of the time. (PMI)
51. US$75 million of every US$1 billion spent on projects is at risk due to ineffective communications. (PMI)
52. Rework commonly costs between 2% and 20% of a project’s contract value (most studies cluster around 4–10%). (Construction Industry Institute)
53. Project schedule, cost, and scope performance significantly influence customer satisfaction (Academic studies linking project performance to client satisfaction).
54. Over 70% of customer-experience leaders report struggling to design projects that boost loyalty and deliver measurable results. (Gartner)
55. 1 in 5 projects is unsuccessful as a direct result of poor communication. (PMI)
56. Projects integrating sustainability/ESG goals are significantly more likely to succeed, yet adoption remains low (~23%). (PMI)
57. Median global salary for project managers in 2025 reached approximately $92,000. (Plaky)
Project Management Trends: The Future of Project Management
These project management trends highlight a clear shift toward automation, real-time decision-making, flexible frameworks, and fully distributed teams. Let’s take a look:
1. AI-Driven Project Planning
AI is increasingly being used to analyze project data, predict bottlenecks, automate task allocation, and generate more accurate timelines. It eliminates guesswork from planning and enables teams to move faster with greater accuracy.
How to Utilize:
Use AI-powered PM tools to automate scheduling, forecast delays early, and create data-backed plans that adjust dynamically as work progresses.
2. Increased Demand for Real-Time Analytics
Organizations now expect instant visibility into project health, resource utilization, cost status, and risks—not monthly reports. Real-time dashboards are becoming the standard for decision-making.
How to Utilize:
Implement reporting tools that centralize data into live dashboards, allowing stakeholders to monitor progress, make informed decisions, and intervene before issues escalate.
3. Hybrid Project Management Models
Teams are blending Agile, Waterfall, and other frameworks to accommodate fast-moving requirements while maintaining structured oversight. Flexibility and governance now coexist by design.
How to Utilize:
Develop a hybrid PM framework tailored to project type—use Agile for development cycles and Waterfall for compliance-heavy work—to balance speed with predictability.
4. Rise of No-Code/Low-Code PM Solutions
More organizations are adopting no-code/low-code tools to customize workflows, automate tasks, and build internal PM solutions without engineering support.
How to Utilize:
Encourage teams to create custom dashboards, workflows, or automations using low-code platforms to reduce dependency on IT and speed up process improvements.
5. Remote-Native Project Teams
Distributed teams are becoming the norm, making asynchronous collaboration tools and digital project environments essential for productivity.
How to Utilize:
Standardize on remote-friendly tools for documentation, communication, and task management, and establish clear async workflows to ensure smooth collaboration across time zones.
6. Stronger Focus on Risk Management
Risk identification, monitoring, and contingency planning are receiving more attention as projects become more complex and data-heavy. Proactive risk management is now a core success factor.
How to Utilize:
Establish a continuous risk management cadence by utilizing risk registers, AI-based risk scoring, and regular review cycles to proactively prevent issues rather than react to them.
Leverage Project Statistics to Better Plan & Deliver Your Projects
Project management statistics show a consistent pattern: teams that use data make better decisions, allocate resources more effectively, and deliver projects with fewer delays.
Understanding trends in productivity, collaboration, budgets, and risks enables organizations to stay ahead, rather than reacting to problems later.
As project environments become increasingly complex, relying on clear, reliable data—not guesswork—provides teams with the clarity they need to plan, track, and execute projects successfully.
Tools like ProProfs Project make this easier by offering simple task tracking, automated workflows, real-time reports, and collaboration features that help teams stay aligned and deliver on time.
FREE. All Features. FOREVER!
Try our Forever FREE account with all premium features!