
A workflow goes hand in glove with an organization’s final goals and objectives. It is the pictorial representation of a project’s path, right from project initiation to its closure. The layout defines the tasks, activities, and milestones to be accomplished while moving the project to its finish line.
Perfecting an ideal workflow diagram is not an overnight task. It is built through trials and errors from previous project experiences. As a project manager, you have to stay on your feet constantly. Tracking, monitoring, and rectifying deviations from the set path becomes easier with a well-laid workflow diagram in place.
Simply put, a workflow diagram is a breakdown of the tasks and processes of your project. It helps you streamline your processes and keep everyone on track with project progress.
This blog will explore workflow diagrams in detail and help you understand how creating a solid workflow diagram is your best bet to project success.
Let’s dive in!
What is a Workflow Diagram?
A workflow diagram is a step-by-step process that defines the path of project execution. Reflecting the project tasks and activities, it standardizes the sequence of project processes.
This well-defined workflow acts as a definitive flow of how the project will move through its life cycle. This flowchart guides the team with the path to follow to execute a project successfully.
Thus, the next time you find yourself in a poorly executed project muddle, you know exactly which piece to fix as the first step towards ensuring a well-executed project that delivers results as expected.
Breaking Down the Workflow Diagram
Still not convinced about why you need a workflow diagram for your everyday organizational activities?
Don’t worry. We’re here to guide you.
Think back to the last time that you started with a project. Was it smooth? Was each step clear? Did the team fumble frequently in uncertain situations?
The reality is that no project execution is absolutely perfect. However, a well-planned project workflow is bound to help ease project management tenfold and significantly impact the overall output.
A successful workflow diagram conveys a clear understanding of how the project will move forward. It lays down definite tasks and activities, which provides team members with transparent project processes.
Read More: What is Task Management & How Does a Software Help
Common Related Terms
We understand that there might be a question lingering at the back of your mind. Let’s resolve that first.
Yes, flowchart and business process mapping are two terms that seem similar to a workflow. However, they must not be interchangeably used. We will look at their definitions in relation to a workflow below to better understand these related terms.
Flowchart: A flowchart depicts the workflow of your project or your organization in sequential order. The diagrammatic representation illustrates the workflow tasks in boxes and conveys the order of task completion through arrows.
Business Process Mapping: Business process mapping is a vast term. It involves mapping all the activities that help run a business i.e. planning, analyzing, executing, and delivering projects. Defining a workflow is part of business process mapping.
When to Use a Workflow Diagram?
The purpose of a workflow diagram is to give a clear overview of how your project will move forward. Adopting a workflow diagram is a good idea if you are looking to:
- Improve business processes – A workflow helps define each step of the project execution process. It streamlines processes across teams and departments, leading to better business outcomes.
- Coordinate team efforts – A well-laid workflow guides team efforts in the same direction. This helps bring teams together to collaborate and communicate for a shared business goal.
- Monitor project progress – Having a good workflow that you can follow and go back to whenever required ensures that your project aligns with set goals and performs to the best of its ability.
- Secure future projects – Delivering a successful project while following a specific workflow acts as a template for delivering projects of similar nature in the future.
Even though a workflow diagram originated in the manufacturing industry, it has been conveniently adopted across fields and industries like education, IT, medical, commerce, and much more. Right from the initiation to project closure, a good workflow surpasses any rigid boundaries and comes in handy for streamlining processes and delivering projects across teams, departments, fields, or industries.
Map the project management process phases using a workflow diagram. Guide: What Is the Project Management Process.
Steps to Create a Workflow Diagram: From Analysis to Design
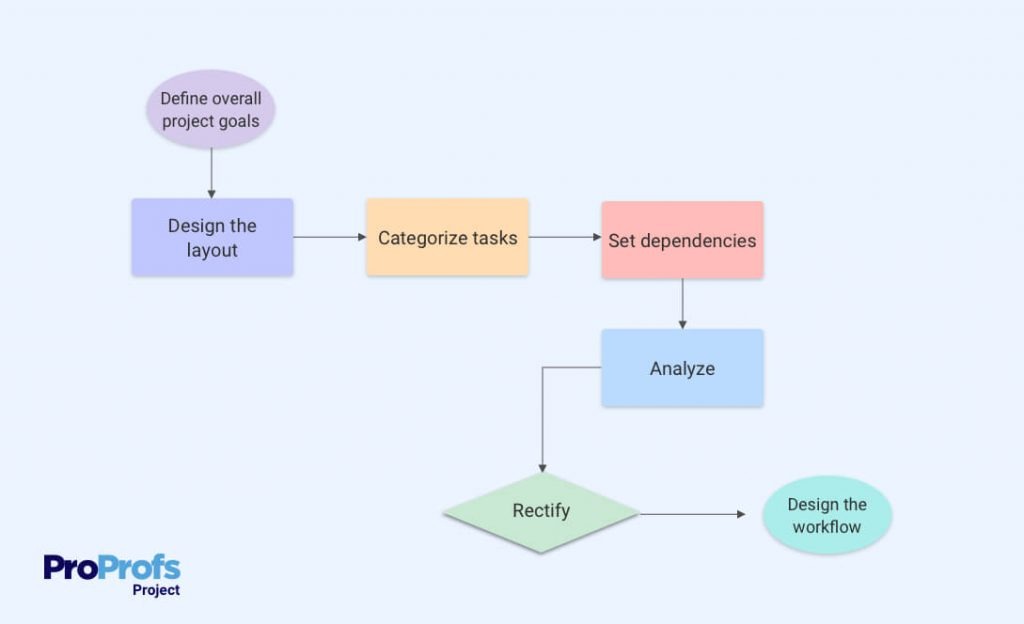
Creating a simple workflow diagram is easier when you go step by step and analyze the potential impact of each stage of the workflow on the overall business goals. Let’s go through the steps below:
Step 1: Define overall project goals
Determine the project goals. See if they align with the overall business goals of the organization.
Step 2: Design the layout
Roughly design the stages of the project’s life cycle. Layout the deliverables and create a map of the probable steps in the workflow.
Step 3: Categorize tasks
Divide the tasks into categories. Decide which tasks will fall into which phase of the project.
Step 4: Set dependencies
After dividing the tasks, set dependencies for them; line them up in a sequence to be performed in a defined order.
Step 5: Analyze
Now that you have arranged the tasks, deeply analyze the actions and the flow of the project. Can you spot any inconsistency? Or is there some other arrangement of tasks that you feel would fare better? Look carefully for any potential risks or deviations from the pre-defined project goals. You may even loop in team members, clients, and stakeholders for the same. A detailed workflow analysis is primary to ensuring a sure-shot winning workflow.
Step 6: Rectify
Rectify anything that you deem necessary. No matter how many hours you may have put in to arrive at the existing workflow, go back and rectify the input of the workflow at any point in time. Why? Well, better late than sorry!
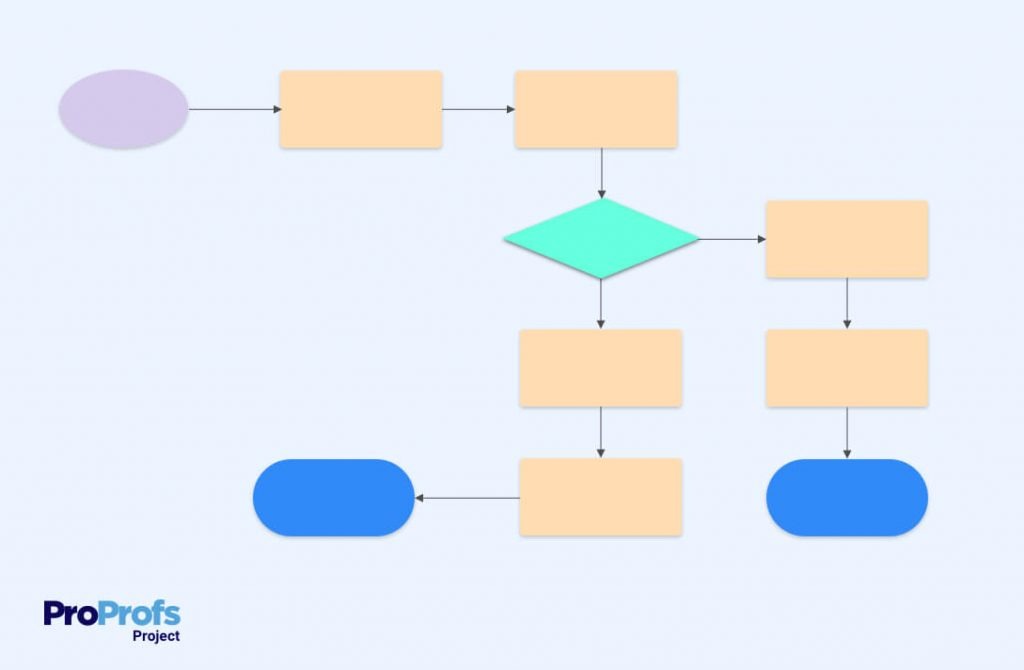
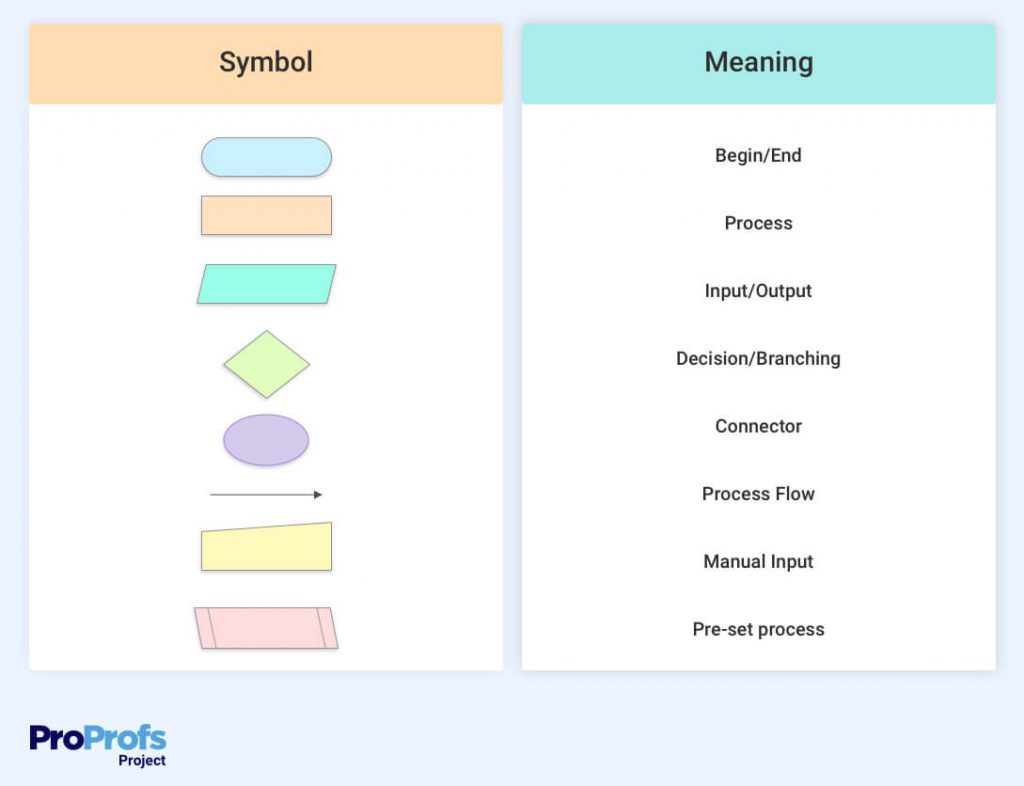
Once you have performed each of these steps, you may now put forward the best analyzed workflow and create a clear design for team members to follow. The workflow elements may be laid out clearly using specific shapes and standardized symbols such as an oval, a circle, a rectangle, or an arrow. These further represent the structure of the workflow without any discrepancies.
Read More: How to Make a Gantt Chart: Step-by-Step Guide for Beginners
Real-Life Workflow Diagram Examples
A workflow diagram is an integral part of any industry or process. Following a set workflow is what sets the business for success.
Let’s look at a few industry-specific workflow examples.
Project Management:
- Resources are approved
- Tasks are allocated
- Feedback is incorporated
- Project is delivered
E-commerce:
- Order is placed
- Item is packed
- Package is shipped to the customer’s nearby warehouse
- Package shipped to the customer
Marketing:
- Campaign is planned
- Resources are acquired
- Campaign is launched
- Results are analyzed
Human Resource:
- Offer letter is released by HR
- Offer letter is accepted by the new employee
- Training and orientation starts
- Routine check-ins with new employee
Move from static workflow diagram to dynamic workflow automation. Guide: Workflow Automation.
Types of Workflow Diagrams
The shapes for which content is not written here please keep the same content as it is in the given reference, just tweak the design, order, and coloring of that shape so that it doesn’t look very similar
We have listed the most popular types of workflow diagrams. You can count on any of these types to enable a smooth-flowing project.
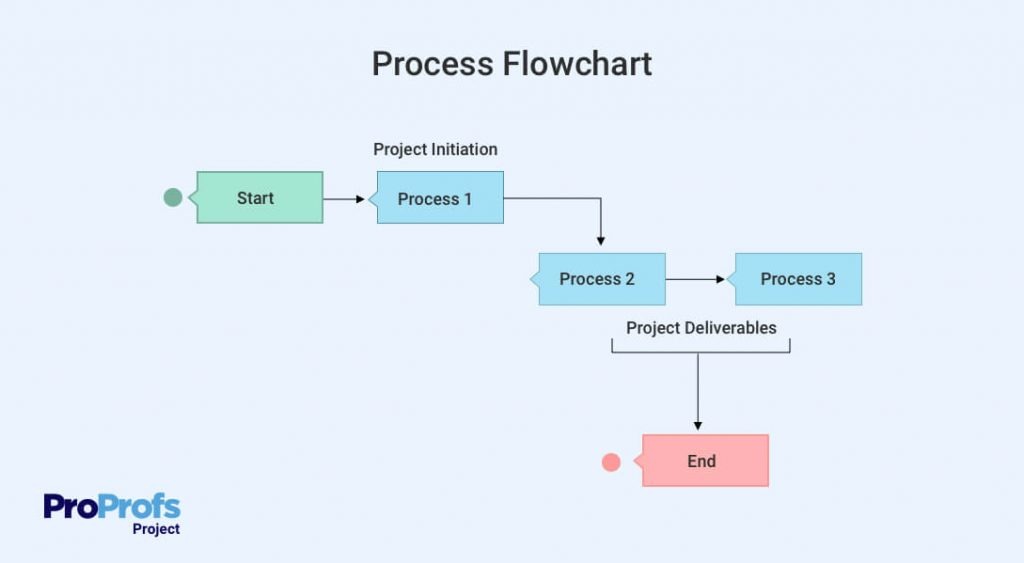
1. Process Flowchart:
A process flowchart is a visual representation of the sequence of tasks, activities, or processes that will form the project’s life cycle. With well-defined and systematic steps, it displays the direction of flow through arrows or any other symbol deemed fit to indicate the path of the next activity. It is simple to create and understand, involving no expert training for its formation.
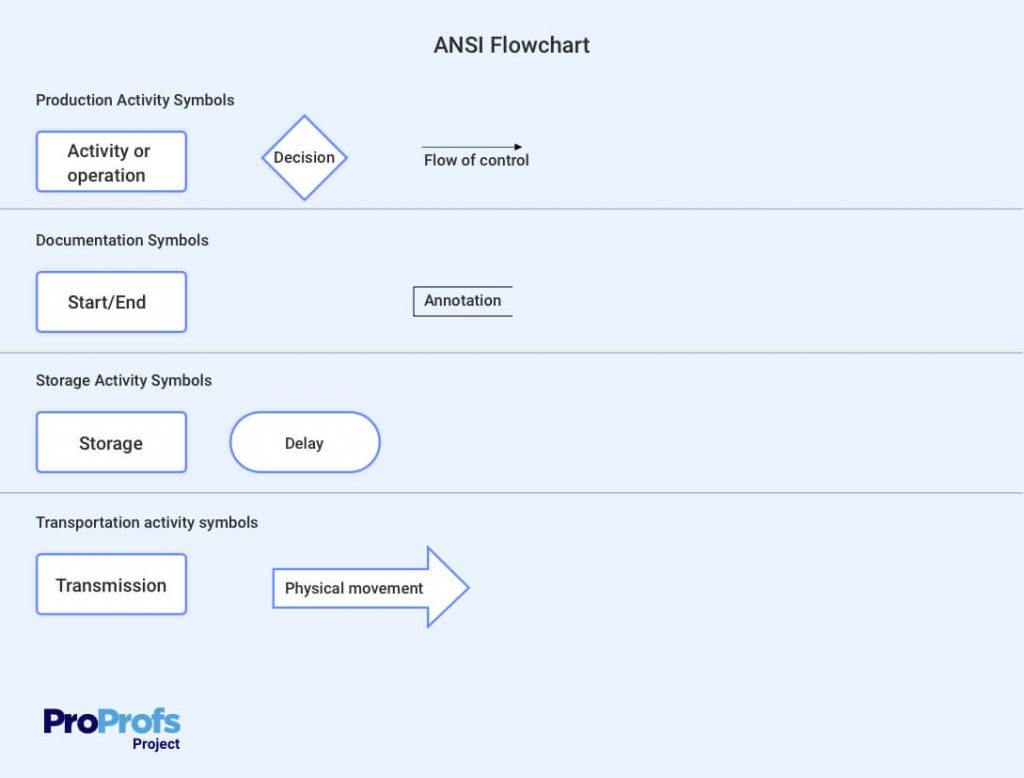
2. ANSI Flowchart:
The American National Standards Institute (ANSI) flowchart uses symbols to convey the workflow of a project. These symbols may include a circle, a rectangle, a zigzagged arrow, and a fat arrow. Each of these symbols denotes a pre-defined expression or interpretation that helps in understanding the project workflow within seconds.
Read More: 10 Charts & Diagrams for Better Project Management
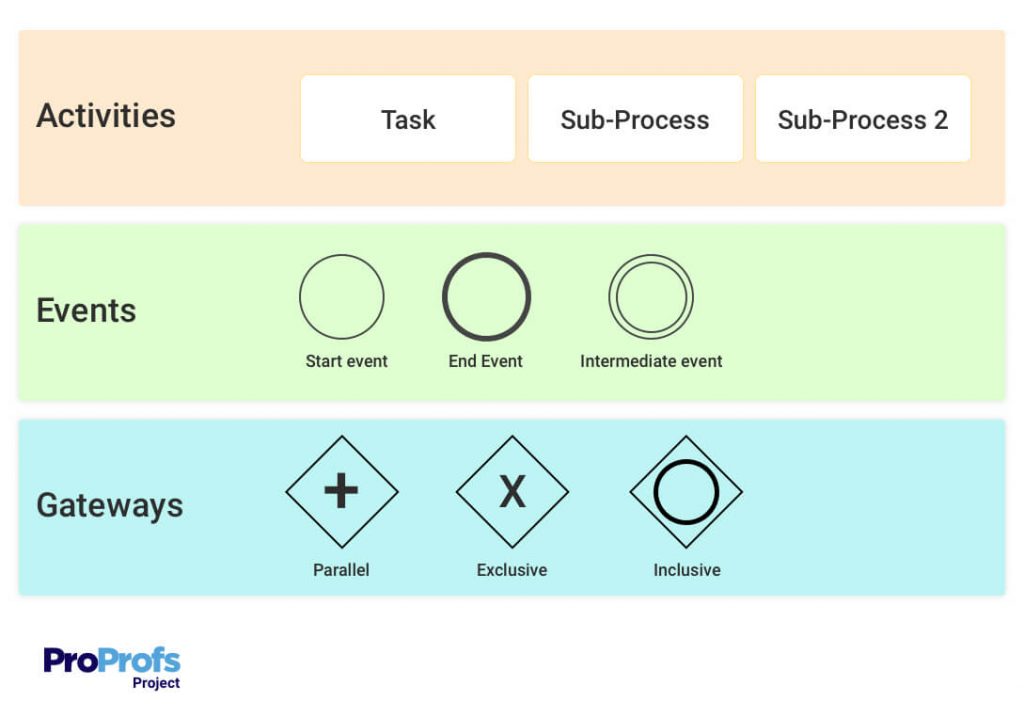
3. Business Process Modeling Notation Flowchart:
The Business Process Modeling Notation (BPMN) flowchart illustrates the processes of a project. It imparts an analytical representation of the workflow to enable process improvement with each new workflow. An easy-to-create flowchart, this diagram bridges the gap between workflow and its implementation by simplifying the comprehension of project tasks and activities.
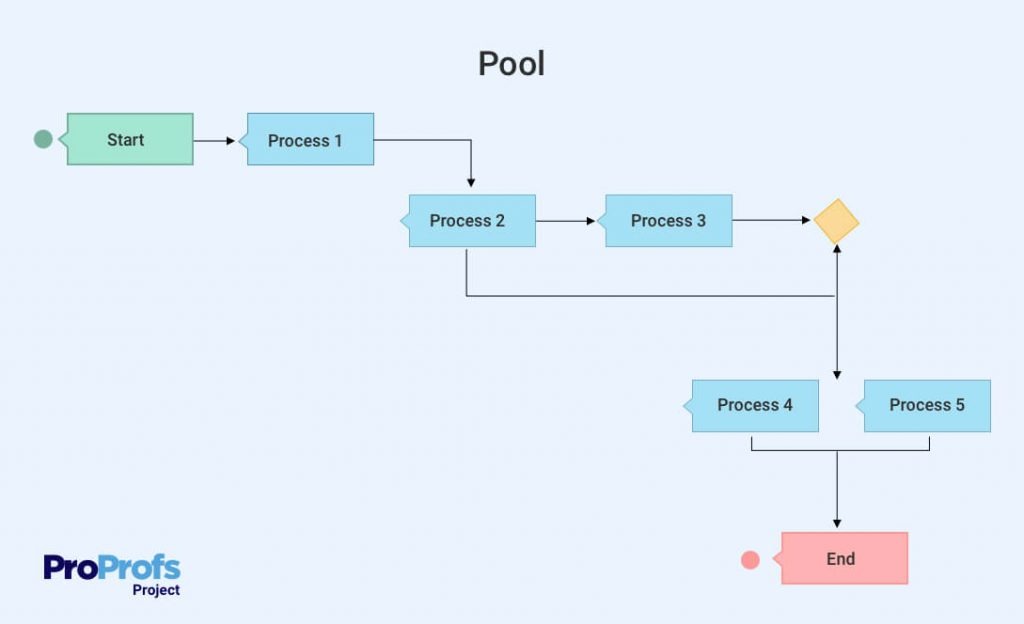
4. Swimlane Flowchart:
The Swimlane diagram provides clarity into a project’s workflow. It dives deeper into who will perform which task, enabling thorough documentation of a project’s processes. It is great for establishing accountability within the team.
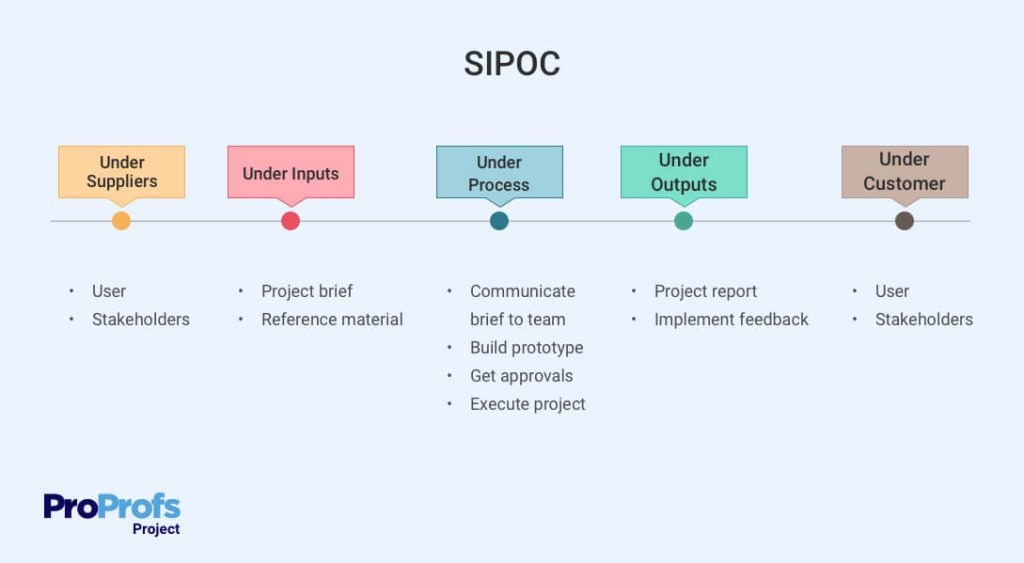
5. SIPOC:
The Supplier-Input-Process-Output-Customer method summarizes the project processes from start to finish. It identifies the suppliers, inputs, processes, and more to deliver an output that is in alignment with set business goals and objectives.
Read More: Effective Project Management in Small Business Organization
FAQs:
1. How do you make a good flow chart?
Consider the following tips for creating a good flow chart:
- Determine the purpose of the flowchart
- Use consistent shapes and symbols
- Let the chart flow either from left to right or from top to bottom
- Keep the processes as minimal as possible for a clear understanding
- Analyze and evaluate the design for any deviations from the set goals
2. Should flowcharts be horizontal or vertical?
Ideal flowcharts should flow from top to bottom and from left to right. They should be consistent in the way they flow throughout the project’s life cycle.
FREE. All Features. FOREVER!
Try our Forever FREE account with all premium features!


![10 Best Risk Management Software in 2026 [Reviewed]](https://www.proprofsproject.com/blog/wp-content/uploads/2022/12/Top-10-risk-Management-Software.png)