Most project managers I know are not bad at their jobs. They are just working with bad information.
I have spent years watching teams run projects off spreadsheets, sticky notes, and email threads, then wonder why they keep missing deadlines and going over budget. The problem is not effort. It is that every decision, who gets what task, how to handle a delay, where to shift resources, gets made on incomplete data. Data-driven decision making in project management fixes that. It gives you a live, honest picture of your project so every call you make is grounded in facts, not feelings.
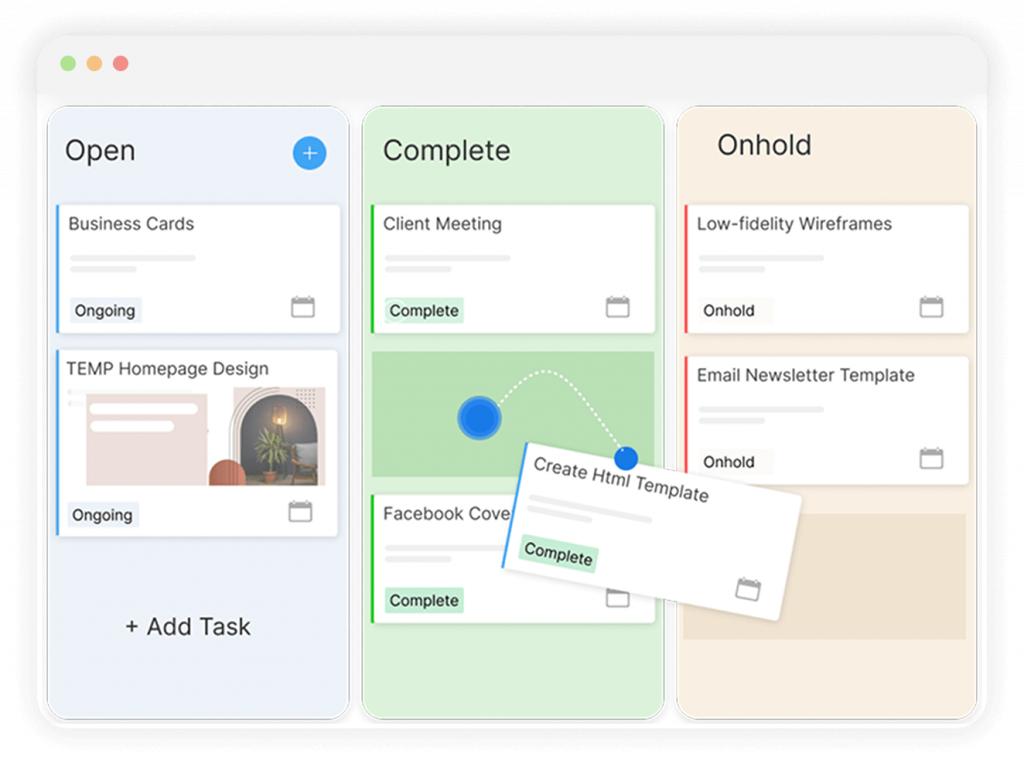
According to a study by PMI in 2020, organizations waste an average of 11.4% of every dollar invested because of poor project performance. For a team running a $500,000 project, that is $57,000 quietly disappearing. The good news is that most of that waste is preventable when teams start using data to drive their decisions. Tools like ProProfs Project make this accessible to teams of any size, giving you dashboards, task tracking, and workload visibility without the complexity of enterprise software.
What Is Data-Driven Decision Making in Project Management?
Data-driven decision making in project management is the practice of collecting, organizing, and using project data to guide every major call on a project. This includes decisions about task assignments, timelines, resource allocation, budget adjustments, risk responses, and stakeholder updates.
Instead of asking “what does my gut say?”, a data-driven project manager asks “what does the data show?” The shift sounds simple, but it changes everything about how a project runs.
Core data types used in project decision making:
- Task completion rates (what percentage of tasks are on track vs. overdue)
- Deadline adherence (are milestones being hit on time?)
- Resource utilization (is anyone overloaded or sitting idle?)
- Budget variance (are actual costs tracking to forecast?)
- Risk indicators (what issues are escalating toward critical?)
- Stakeholder feedback (are approvals and reviews happening on schedule?)
Better decision making strengthens overall project leadership. Roles, skills & benefits: How to Master Project Leadership.
Why Does Data-Driven Decision Making Matter for Project Teams?
Poor decision making in project management is expensive. It causes missed deadlines, budget overruns, and resource burnout. The root cause is almost always the same: the person making the call did not have the right information at the right time.
Here is what the data says about the cost of flying blind:
- A study by PMI in 2018 found that organizations waste 9.9 cents of every dollar due to poor project performance, and nearly half of all projects (48%) are not completed on time.
- According to a study by McKinsey in 2022, companies with strong data cultures make decisions five times faster than those without.
- A study by PMI in 2025 shows that project professionals with high business acumen, which includes knowing how to read and act on project data – experience 27% lower project failure rates.
For most teams, the problem is not a lack of data. It is that the data lives in five different places: a spreadsheet here, an email chain there, a Slack message somewhere else. No one has a single, clean picture. Data-driven decision making solves this by centralizing your project data so decisions happen from one source of truth.
How Does Data-Driven Decision Making Work in Practice?
Data-driven decision making in project management follows a clear process. Here is how it works step by step:
Step 1: Define What You Need To Decide
Before you look at any data, get clear on the decision you are making. Is it about task prioritization? A resource conflict? A deadline that needs to shift? Knowing the decision shapes which data matters.
Step 2: Collect The Right Data
Pull your task status, workload report, timeline, and budget tracking from your project management tool. Do not go hunting across tools. If data lives in more than one place, it is already a problem.
Step 3: Analyze For Patterns
Look for delays that are clustering around one person, tasks that keep getting pushed, or budget lines that are running ahead of forecast. Patterns are decisions waiting to be made.
Step 4: Apply A Decision Making Framework
Use a structured model (see the next section) to evaluate your options objectively. This removes bias and helps you explain your reasoning to stakeholders.
Step 5: Log The Decision
Record what you decided, why, what data informed it, and what the expected outcome is. This is your project decision log. It becomes invaluable when things change or when you are building on past projects.
Step 6: Monitor The Outcome
Check back. Did the decision produce the expected result? If not, what does the data tell you now? Data-driven decision making is a loop, not a one-time event.
Effective decision making often involves conflict resolution techniques. Step-by-step guide: What Is Conflict Management in Project Management?.
What Are the Best Decision Making Models in Project Management?
A decision making model in project management is a structured framework that helps you evaluate options systematically, reduce bias, and arrive at a defensible choice. Here are the five most effective ones:
1. Decision Matrix
A decision matrix scores multiple options against a set of criteria. You list your options in rows, your criteria (cost, time, risk, impact) in columns, assign weights to each criterion, and score each option. The highest weighted score wins.
Best for: Choosing between vendors, tools, or approaches when multiple factors matter equally.
2. RACI Matrix
A RACI matrix defines who is Responsible, Accountable, Consulted, and Informed for every decision. It is not a scoring tool. It is an ownership tool. It prevents the most common decision making failure in projects: nobody knowing who actually makes the call.
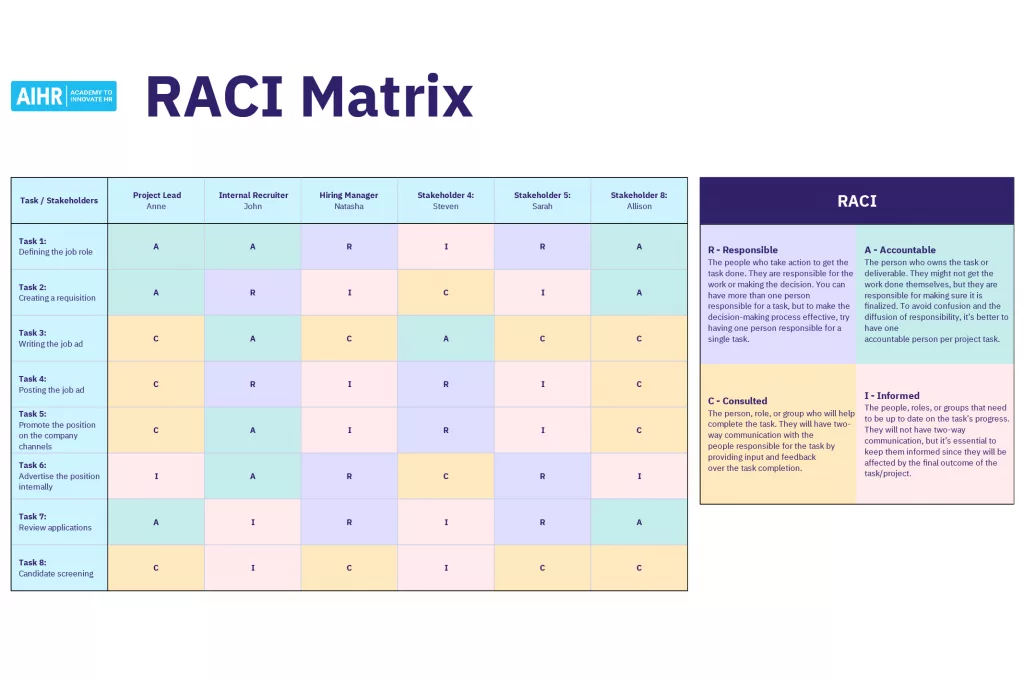
Best for: Clarifying decision ownership on complex projects with multiple stakeholders.
3. Impact-Effort Matrix
An impact-effort matrix plots tasks or decisions on a 2×2 grid: high impact vs. low impact on one axis, and high effort vs. low effort on the other. The top-left quadrant (high impact, low effort) tells you exactly where to focus first.
Best for: Prioritizing backlog tasks, feature requests, or scope decisions.
4. Cost-Benefit Analysis
Cost-benefit analysis assigns a monetary or time value to every option and its expected outcomes. You compare what each option costs against what it produces. The option with the best net benefit wins.
Best for: Budget decisions, build-vs-buy choices, or deciding whether to continue a project that is off track.
5. Risk Assessment
A risk assessment maps potential decisions to their probability and impact. Before committing to a course of action, you identify what could go wrong, how likely it is, and what the fallout would be.
Best for: Any decision made under uncertainty, which in project management is most decisions.
What Are the Most Useful Decision Making Tools in Project Management?
Decision making tools in project management are the systems and features that give you the data to apply the models above. These are the ones that matter most:
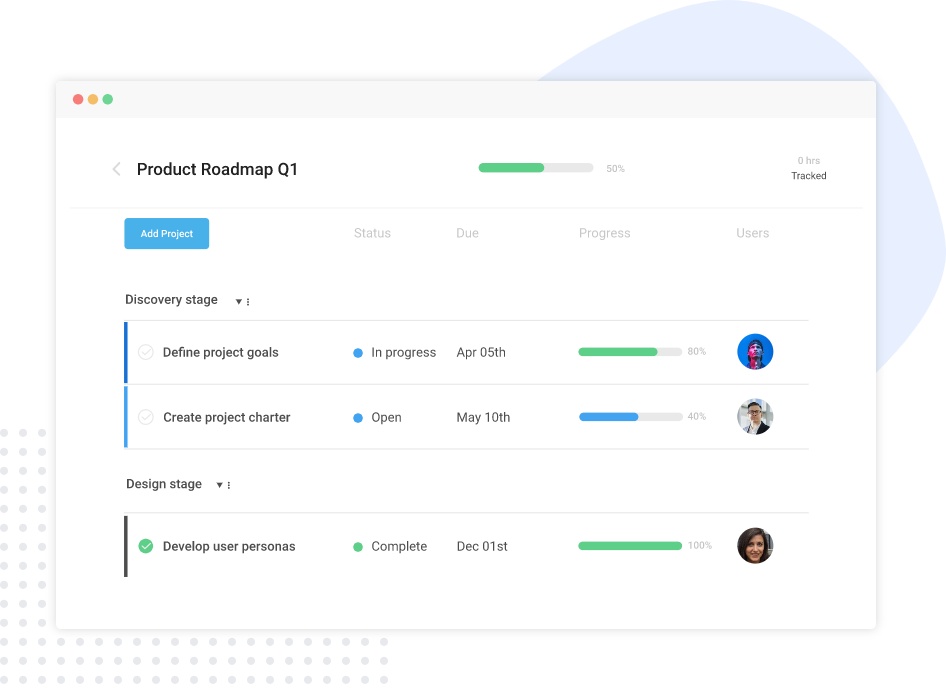
1. Project Dashboard
A project dashboard shows the real-time status of all tasks, milestones, deadlines, and team workload in one view. Instead of pulling data from spreadsheets or chasing status updates in meetings, you see the current state of your project at a glance.
Entity attributes:
- Displays task completion percentage per project
- Shows overdue tasks highlighted by severity
- Tracks milestone progress against original timeline
- Breaks down workload per team member
- Updates in real time as tasks are marked complete
ProProfs Project includes a project tracking dashboard that gives PMs and team leads this visibility without any configuration or BI setup, which makes it practical for teams of 5 to 300.
2. Project Decision Log
A project decision log is a running record of every significant decision made on a project: what was decided, who decided it, what data supported it, and what the expected outcome was.
Most teams skip this. Then six months later, nobody remembers why a key scope change was approved, or why a vendor was selected. The decision log fills that gap.
Entity attributes:
- Captures decision date, owner, and rationale
- Links decisions to relevant tasks or milestones
- Creates accountability and traceability across the project lifecycle
- Serves as a reference for post-project reviews and future planning
3. Workload Management Reports
A workload report shows how tasks are distributed across your team. It tells you who is overallocated, who has capacity, and where the bottlenecks are building before they become delays.
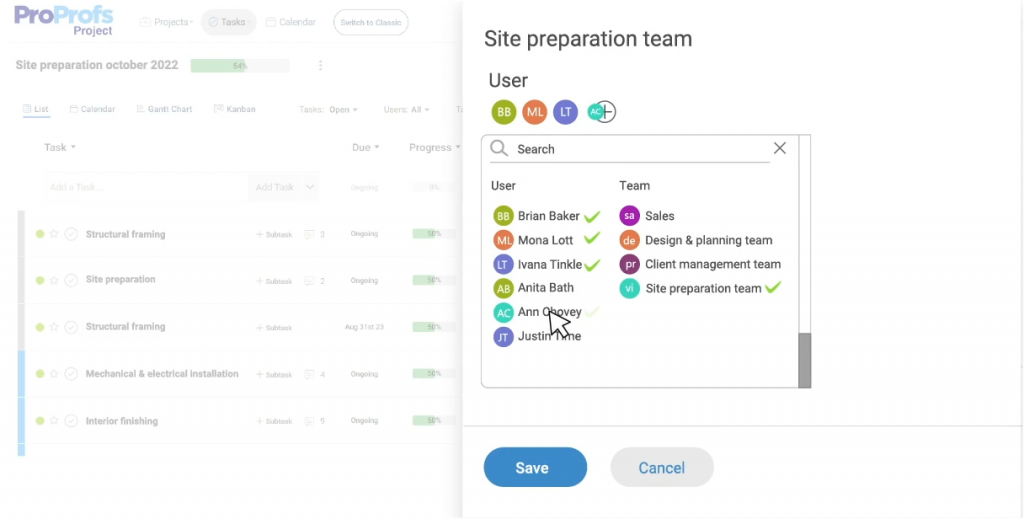
This is the single most underused data source in small and mid-sized project teams. Most teams only discover a resource problem after someone misses a deadline. A workload report surfaces it two weeks earlier.
What Problems Does Data-Driven Decision Making Solve?
Here is a direct map of the most common project management pain points and how data-driven decision making addresses each one:
| Pain Point | What Happens Without Data | What Data-Driven PM Does |
| Missed deadlines | PMs find out at the deadline, not before | Timeline tracking flags delays 1-2 weeks early |
| Resource overload | Someone burns out or drops tasks | Workload reports show imbalance before it breaks |
| Scope creep | Changes slip in without impact analysis | Decision log and change tracking create accountability |
| Budget overruns | Costs exceed forecast without warning | Budget variance tracking alerts at threshold |
| Poor stakeholder reporting | Updates are verbal, inconsistent, or late | Dashboards give stakeholders self-serve visibility |
| Repeating past mistakes | No record of what went wrong or why | Decision logs build institutional memory |
How Do Spreadsheets Compare to Data-Driven Project Management Tools?
Spreadsheets are where most teams start their project management. They are free, familiar, and flexible. But they are also static, manual, and siloed. When you use a spreadsheet to manage a project, you are managing yesterday’s data, not today’s.
Here is the core difference:
Spreadsheets:
- Updated manually, so always slightly out of date
- No automatic alerts when a task goes overdue
- No workload visibility across the team
- No decision trail or change history
- Each team member works from their own version
Data-driven project management tools:
- Tasks update in real time as team members work
- Overdue tasks and deadline risks surface automatically
- Workload reports show the full team view
- Every change is logged with a timestamp and owner
- Everyone works from the same source of truth
ProProfs Project sits at the practical end of this spectrum. It is a simple, affordable project management tool built for growing teams that gives you task management, deadline tracking, workload visibility, and reports and analytics in one place without requiring a team of admins to run it. It also offers a forever-free plan for teams just getting started with structured project management.
How Can Data-Driven Decision Making Help Different Industries?
Data-driven decision making in project management is not limited to software companies or enterprise PMOs. Here is how it applies across the industries your team might work in:
Marketing Teams
Marketing teams run multiple overlapping campaigns with shared resources and tight deadlines. Data-driven PM helps them see which projects are behind, where designers or writers are overloaded, and how to report project status to senior leadership without pulling data manually.
The marketing project management guide goes deeper on how these teams can structure their workflows for better visibility.
IT and Software Teams
IT teams manage a mix of internal initiatives and client-facing delivery. Data helps them track sprint progress, surface blockers early, manage dependencies between projects, and make resource calls when competing priorities collide.
For a deeper look at how this plays out day to day, the guide on IT project management covers the specific challenges this team type faces.
Small Business and Service Teams
Small businesses like cleaning companies, real estate teams, field service providers, often manage projects in Excel or just “in someone’s head.” Switching to data-driven PM gives them task visibility, accountability, and a way to manage multiple projects simultaneously without chaos.
Biotech and R&D Teams
R&D teams deal with long timelines, high uncertainty, and complex dependencies. Data-driven PM helps them track overlapping initiatives, manage limited specialist resources, and maintain a clear record of decisions for compliance and audit purposes.
Automotive and Manufacturing Teams
Global manufacturing teams managing projects across multiple regions need real-time visibility, automated notifications, and a single project view that works across time zones. Data-driven PM replaces the daily follow-up call with a live dashboard.
How Does Data-Driven Decision Making Improve Stakeholder Reporting?
One of the most underrated benefits of data-driven decision making in project management is what it does for stakeholder communication.
Most project teams spend hours preparing status reports for leadership. They pull data from spreadsheets, write summaries in slides, and present information that is already outdated by the time anyone reads it.
When you run your projects through a tool that tracks data in real time, stakeholder reporting changes completely:
- Live Dashboards Replace Status Slides: Executives and sponsors can see project health at any time without waiting for a weekly update.
- Data Backs Every Decision. When a PM recommends a scope change or timeline extension, the supporting data is already in the tool. No scrambling to justify the call.
- Accountability Is Visible. Every task has an owner. Every decision has a log. Nobody can claim they did not know.
- Reporting Takes Minutes, Not Hours. Filters and reporting views in a PM tool generate the summary automatically. ProProfs Project’s reports and analytics feature is built specifically for this, so PMs spend less time assembling updates and more time acting on them.
What Key Performance Indicators Should Project Managers Track?
These are the decision making KPIs that matter most for data-driven project management:
Schedule and Delivery KPIs:
- On-time delivery rate (percentage of tasks and milestones completed by due date)
- Schedule variance (planned completion date vs. actual)
- Cycle time (average time from task creation to completion)
Resource and Workload KPIs:
- Resource utilization rate (percentage of available capacity in use)
- Task distribution balance (spread of tasks across team members)
- Overdue task rate per team member
Budget and Cost KPIs:
- Budget variance (planned spend vs. actual spend)
- Cost performance index (value delivered per dollar spent)
- Percentage of tasks completed within original estimate
Decision Quality KPIs:
- Decision cycle time (how long from decision trigger to final call)
- Decision reversal rate (how often decisions get walked back due to new information)
- Stakeholder escalation frequency (how often decisions get pushed up the chain unnecessarily)
For a deeper look at which metrics matter most, the project management KPIs and project management metrics guides are a useful reference.
How to Start Using Data-Driven Decision Making on Your Projects
You do not need to overhaul your entire operation to start making better decisions. Here is a practical starting point for most teams:
Step 1: Move Your Projects Out Of Spreadsheets And Into A Single Tool
Pick a project management platform that tracks tasks, deadlines, and workload in one place. This is the foundation. If you are still comparing options, the guide to choosing project management software can help you narrow it down.
Step 2: Define Your KPIs Before The Project Starts
Agree on three to five metrics that matter for this project. Deadline adherence, budget variance, and resource utilization are a good baseline.
Step 3: Build A Project Decision Log From Day One
Create a simple log (even a table in your PM tool works) where every significant decision gets recorded with a date, owner, and rationale.
Step 4: Run A Weekly Data Review, Not A Status Meeting
Replace your “what’s everyone working on?” meeting with a 20-minute review of your dashboard data. Let the numbers lead the conversation. Setting up notifications and reminders can keep the team aligned between reviews without extra meetings.
Step 5: Use Your Decision Making Framework Consistently
Choose one framework (decision matrix for complex choices, impact-effort for prioritization, RACI for ownership) and use it every time a significant decision comes up. Consistency builds the habit.
Make Smarter Project Decisions and Deliver Better Results
The difference between a project that delivers and one that quietly falls apart is almost always the quality of the decisions made along the way. And decision quality depends directly on the quality of information driving those decisions.
Data-driven decision making in project management does not require a data science team or an enterprise BI platform. It requires one thing: a central, honest source of project truth that everyone on the team can see and act on. When you have that, decisions stop being arguments and start being conclusions.
For teams looking for a practical place to start, ProProfs Project makes this straightforward. It is designed for teams that need clarity, not complexity, with dashboards, workload tracking, deadline monitoring, and task management in one place, on a plan that fits a growing team’s budget.
Frequently Asked Questions
Why Is Decision Making So Hard in Project Management?
Decision making is hard in project management because data is usually scattered across multiple tools, people, and formats. Without a single source of truth, project managers either delay decisions waiting for information or make calls without enough context.
What Are the Main Decision Making Methods in Project Management?
The main decision making methods in project management are the decision matrix, RACI matrix, impact-effort matrix, cost-benefit analysis, and risk assessment. Each is suited to different types of decisions, from ownership conflicts to budget choices to prioritization calls.
What Is a Project Decision Log?
A project decision log is a record of every significant decision made on a project, including what was decided, who made the call, what data supported it, and what the expected outcome was. It creates accountability, helps with stakeholder communication, and prevents the same mistakes from recurring on future projects.
How Does a RACI Matrix Help with Decision Making?
A RACI matrix clarifies who is Responsible, Accountable, Consulted, and Informed for each decision. It eliminates the most common project decision making failure: ambiguity over who actually has the authority to make a call. When everyone knows their role, decisions happen faster and with less conflict.
What KPIs Should Project Managers Use for Data-Driven Decisions?
The most important KPIs for data-driven decision making in project management are on-time delivery rate, budget variance, resource utilization rate, task completion rate, and decision cycle time. These five metrics give you a complete picture of project health and flag problems before they become crises.
How Do Decision Making Tools in Project Management Work?
Decision making tools in project management, like dashboards, workload reports, and Gantt charts, collect and display live project data in structured formats that make patterns visible. They reduce the time it takes to gather information and increase the accuracy of the decisions made from it.
How Does ProProfs Project Support Data-Driven Decision Making?
ProProfs Project centralizes task management, deadline tracking, workload visibility, and project reporting in one place. This gives project managers and their teams a single source of project truth, which is the foundation of every good data-driven decision. The platform also includes a forever-free plan for teams getting started.
FREE. All Features. FOREVER!
Try our Forever FREE account with all premium features!